


In this article, we'll be taking a look at how software companies are increasingly leveraging a new framework to grow their product offerings! We’re entering an exciting new era where users can engage with and act on data in new ways. It can be a little overwhelming, but I’m gonna break it down into a few main talking points. 👇
The main talking points include:
- A brief history of embedded analytics.
- Contextual analytics: how it can grow your product offerings.
- Why software companies are turning to contextual analytics for growth.
- Enabling capabilities in your products.
- Which software companies use contextual analytics?
- Our Patient event system.
- Key takeaways.
But before we get into the main subject of this article, a little bit of background on me and Yellowfin.
About me & Yellowfin
I’m currently Head of Product Marketing at Yellowfin. We're a global analytics software company that provides beautifully simple solutions to complex data problems. We work with product leaders like you to embed analytics capabilities into your products.
I've been in the industry for nearly 15 years. Prior to this product marketing role, I dabbled in product development and spent a fair amount of time providing consulting in analytics projects.
During the course of time, I have helped hundreds of companies take their products to the next level with embedded analytics. I hope this article will give you the tools to really crush it in your organization! 💪.
A brief history of embedded analytics
Previously, those who wanted to have analytics capabilities would embed either a dashboard or reporting tool as standalone modules. This was usually an afterthought added separately in the post-product. But we know this isn't exactly the best way.
This has been true for products as well. Users have had to switch between tabs and platforms whenever they need to see the data to support their decisions. But this approach has typically created friction in the user experience and has disrupted their workflows.
Contextual analytics: how it can grow your product offerings
So, what is contextual analytics all about? And how can it help grow your product offerings? Well, what if I told you that contextual analytics is the next level of embedded analytics? How? Because it has evolved to address the pain points experienced by the software companies.
In essence, it is defined as analytic solutions that are directly embedded into product workflows. The analytic solutions around data are now delivered at the point of consumption. They are delivered to the end-user directly.
We all know the pain of having to toggle through endless screens to get all the information you need, right? Well, now your end-users no longer need to switch to a different screen or product when they need more data or context. As a bonus, you'll find that implementing in this way also means that manual analysis is reduced. The product guides end-users towards relevant insights.
Why software companies are turning to contextual analytics for growth
So, what are some of the key factors on why software companies are turning to contextual analytics for growth?
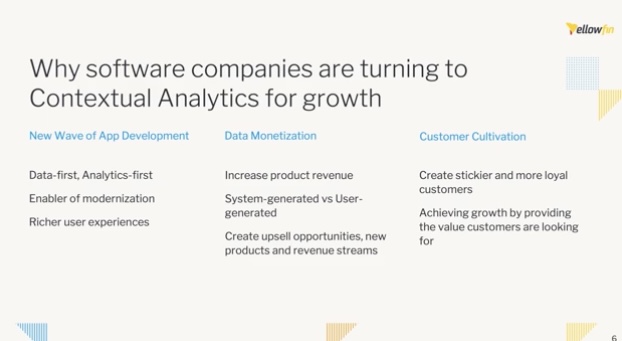
The new wave of app development
We're seeing new products are out there that are data first and analytics first. This means they’re thinking about the value of the product and what it’s going to bring in the space. They’re not just architecting the product around transactions.
Now, if your product is a little bit on the legacy side, this is a great way to modernize it. You can give it a facelift with modern UI, and provide great experiences for your customers without the need to completely re-construct your product.
Data monetization
With better user interfaces, the end result is going to be way more valuable to your users! Because of this, you should be able to charge more for it. Now, if you're following a data-first analytics model for your product, there's also the possibility of monetizing the data generated from the product. But not just that, you can also monetize the data generated by users using your product.
Customer cultivation
Because of the way contextual analytics works, the experience is going to be so much better compared to your competitors. You are creating more loyal customers over time, reducing churn, and increasing the value to your business.
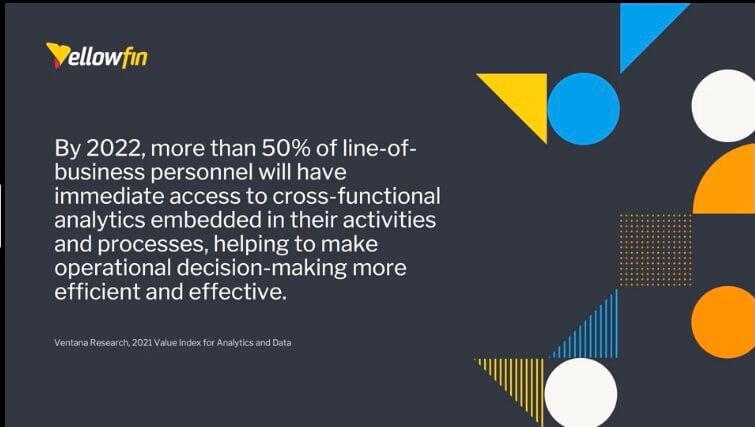
In a report from Ventana research, it’s claimed that by 2022, more than 50% of users will have access to analytics embedded in the activities and processes. This will help them make more efficient and effective decisions.
Enabling capabilities in your products
If you're thinking of including this into your products, what are the capabilities to look out for in contextual analytics?
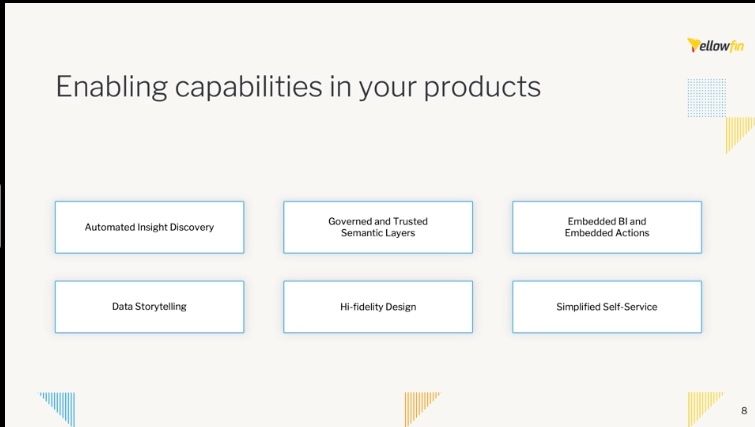
Automated insight discovery
This is more for users who either don’t have much time or lack the drive and skills to perform in-depth data analysis within your product. This is where algorithms can really help. I like to split this into two modes, the first one being:
Pull mode
The users log into your product, and the objective is to help them get a deeper understanding of whatever they're looking at. They could be looking at a chart with data on it. And to give them more insights, you could create a system where they simply click on the data point and engage with smart algorithms.
These algorithms could perform key driver analysis that informs the user what's happening behind the data. And you could actually accompany that with more charts, or natural language explanations as well.
Push mode
This is where the user might not be currently logged into your products, but you want to push relevant insights to them either way.
Automated business monitoring tools can help with that because it continuously scans your data for important changes and patterns. When it finds something critical and interesting, it creates those personalized and timely alerts to the relevant users.
This can potentially reach them on their mobile app. Or, we could even embed these granular alerts against a transaction or an item that they might be looking at within your product. This can not only provide differentiated value to your users but also entice them to log back into your product.
Governed and trusted semantic layers
Now, this might not be important right from the start, but it becomes particularly important as you scale the reach of analytics to your customers. You always want to ensure a single source of truth across your dimensions, your metrics, and definitions.
You want to guarantee that users can only see the data that they’ve got access to. This is critical if you're offering self-service as a value within your products as well.
Embedded BI and embedded actions
The question is, how do you embed the analytic components into your products?
And what kind of components? How granular can they be? Implementing this removes the need for context switching. Your users have insights at their fingertips rather than logging into another app or going to a separate part of your product.
An additional aspect to think about here is when analytics is available to your users at a point of consumption. How do they then close the loop and take actions on insights that you provide, without a need to context switch? Embedded actions are actually really useful here.
Data storytelling
In some sense, data storytelling has always been available, but in really traditional forms. Typically, users would usually export the data out and perform their own analysis either in PowerPoint or Word.
This information would then get disseminated to the rest of the organization for further analysis, These are product capabilities that you can immediately embed into your product, either through data stories or presentations that are with government data and analytic content. That entire experience can be embedded directly into products.
We certainly have customers providing commercial insights for a service, which users then pay more to get access to. Another option is to allow the users to create their own stories as subject matter experts in their domain.
Hi-fidelity design
If you've embedded analytics before, you'll find that most tools provide charts and dashboards. They mostly follow a grid-like layout that looks a little bit uninspired today. The problem is, it doesn’t really make you stand out in any way.
Today, your users expect a data experience that incorporates a much richer design, and a more user-friendly aesthetic. You’ll find platforms out there that can provide a pixel-perfect canvas. There are platforms like Adobe Experience, where you can manage your dashboards.
There are also different kinds of widgets, like images, videos, digital content, and even custom user interfaces which typically make the entire experience much more enjoyable. They really help to keep users hooked on your product.
Simplified self-service
This section is for those of you who have commercial offerings, where you allow your users to self-serve in your data.
The old way
The usual method is through an embedded drag and drop builder of some sort. Unfortunately, this often requires a certain level of skill to use it. There's nothing wrong with that. But if you want to expose a ratio product to more users of varying skill levels, then there are much better options out there.
The new way
Today, you can even embed a guided experience where the user doesn't need to be a technical expert, with something like a natural language query model. Here, the end-user can simply type in their queries in the question bar in plain English and be guided with contextual options on what to ask.
The answers usually come immediately in the form of a chart, or report, or both. If your product is, for example, a Trading App, you can give your users the ability to simply ask questions like, “what are the shares traded by the top 1% of traders over the last six months?”
The answer can come in the shape of a best practice chart or report immediately. And that's the kind of self-service experience you could provide for your users.
Which software companies use contextual analytics?
So which software companies have implemented contextual analytics in some shape or form? Well, there's actually quite a few. The first is… 👇

This is actually quite an interesting company. They do provide several products, one of which is a customer engagement platform. 👇
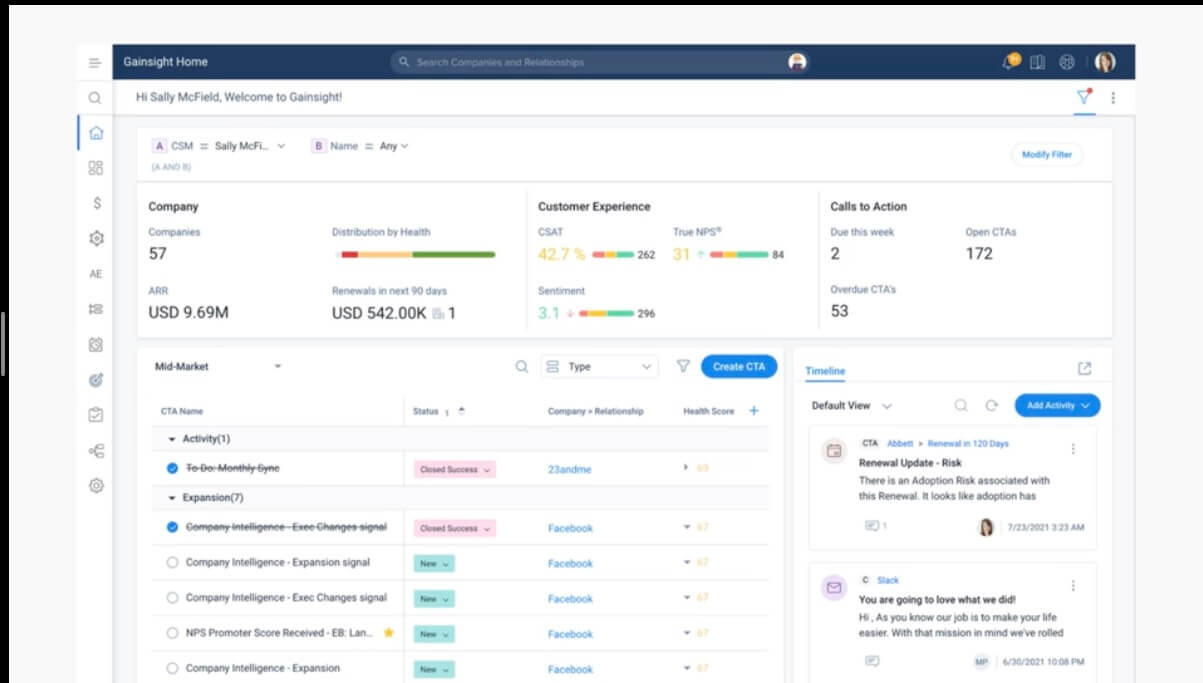
It comes bundled with a set of analytics embedded to help customer success teams in your workflows and to help drive the outcomes that they want.
The interesting thing about this is that most of the data is sucked in from other sources. You have access to analytics in your workflow, as you engage with different tasks and actions.
I think this is a great example of a company thinking about the power of data and analytics first.
The next one is…

This is an Australian product that enables users to engage in low-cost share trading. If you're using this product, you can access stocks and funds in various markets with one trading account.
Here's an example of a stock that you can buy or sell.
As you can see, It gives you the standard information that you would expect in a trading app.
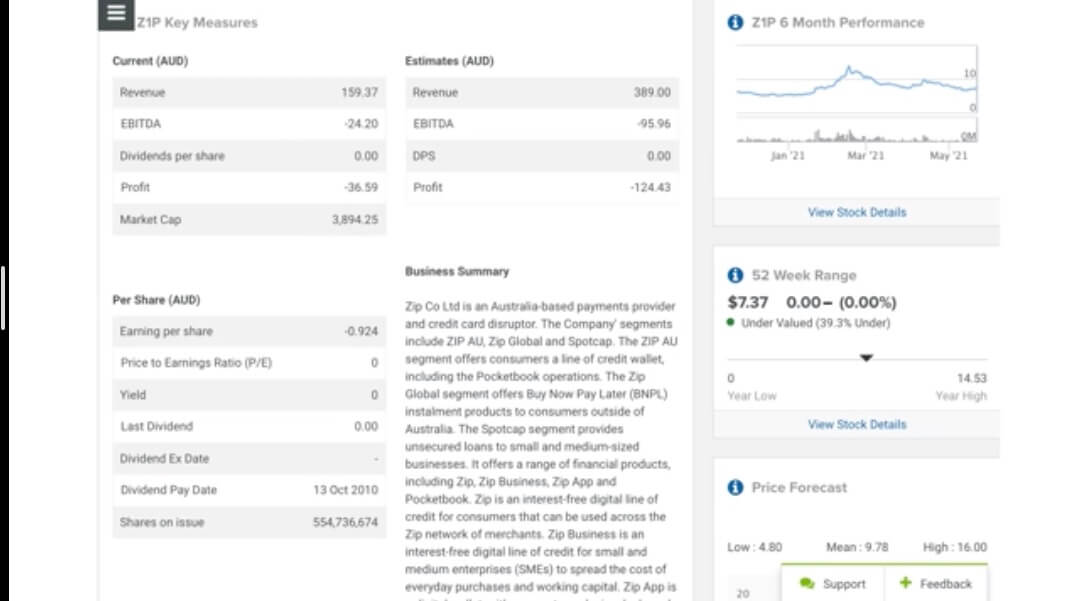
But it gets clever on the next screen…
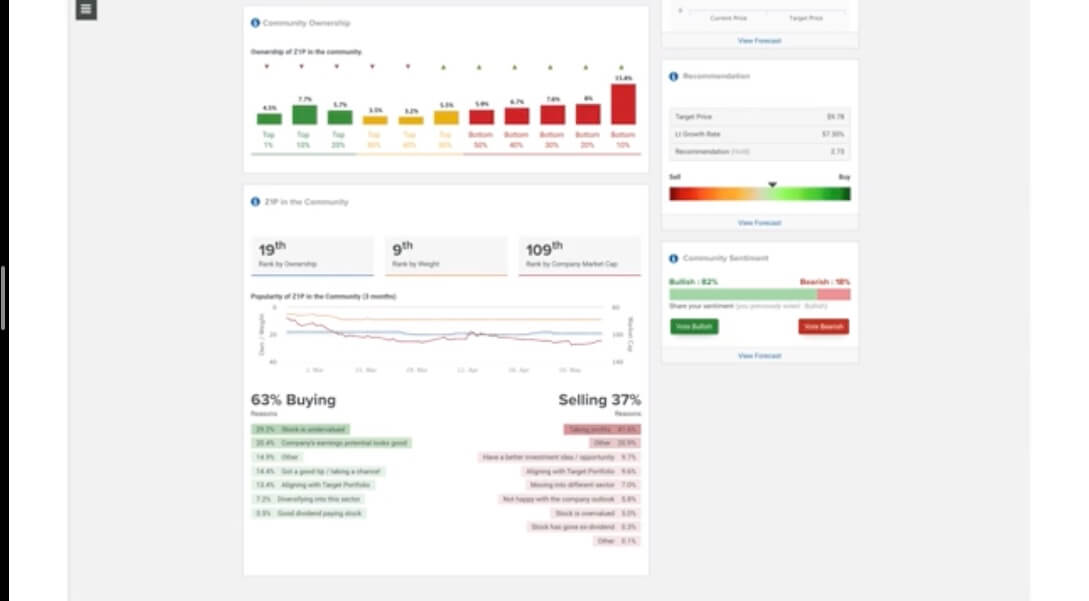
Here, they're infusing contextual analytics into your workflow, which is ultimately helping you buy or sell the stock.
They take the data from people using a product and present the analytics back to you, informing you on who is buying and who is selling. Are they in the top 1% or the top 10%? Naturally, you will want to align with what the top traders are doing. And you want to know what the sentiment is with traders.
As you can see, you can also offer your sentiment by voting on the right with their poll, which then also gets fed back into the analytics. In doing so, we can see that SelfWealth is able to help users make better decisions around what they should trade.
Our Patient event system
This is our system for tracking the well-being of patients by recognizing negative incidents, providing resolutions, and managing them into positive outcomes.

Here, users would typically look at incidents for the day in categories of ‘type.’ And each selection would filter the analytic content below. It's essentially woven seamlessly into their selections. On the right, there are charts or alerts that notify them when incidents are overdue.
With anything that’s gone past a few hours or a few days, they could quickly see immediately. Scrolling down, the end-user will be able to keep track of the most recent incidents allocated to them across incident types and time-to-resolution. 👇
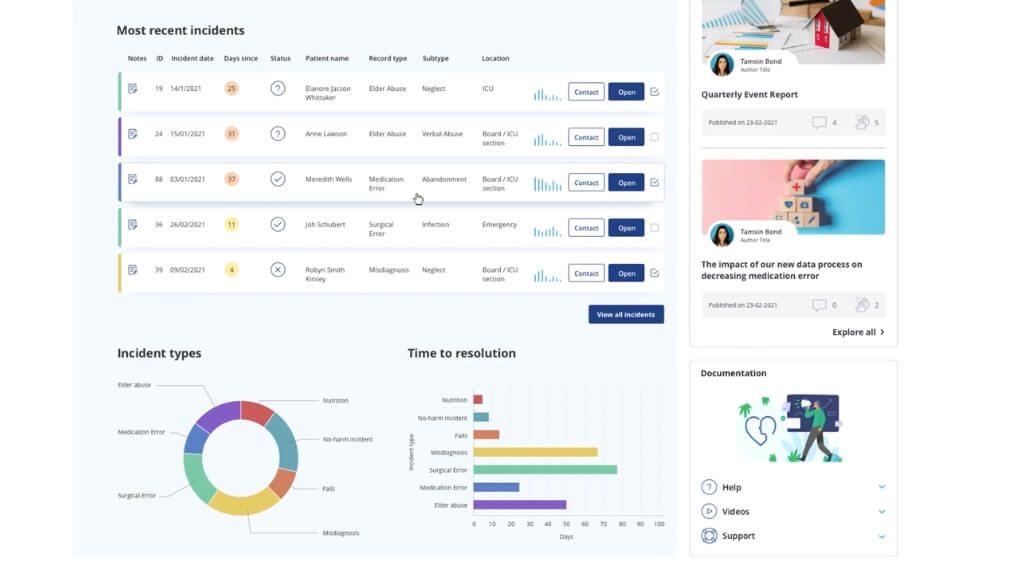
Let's focus on the Incidents table. Now, in their daily rounds, healthcare workers would check on each patient and record the general mood into the system on a numeric scale.
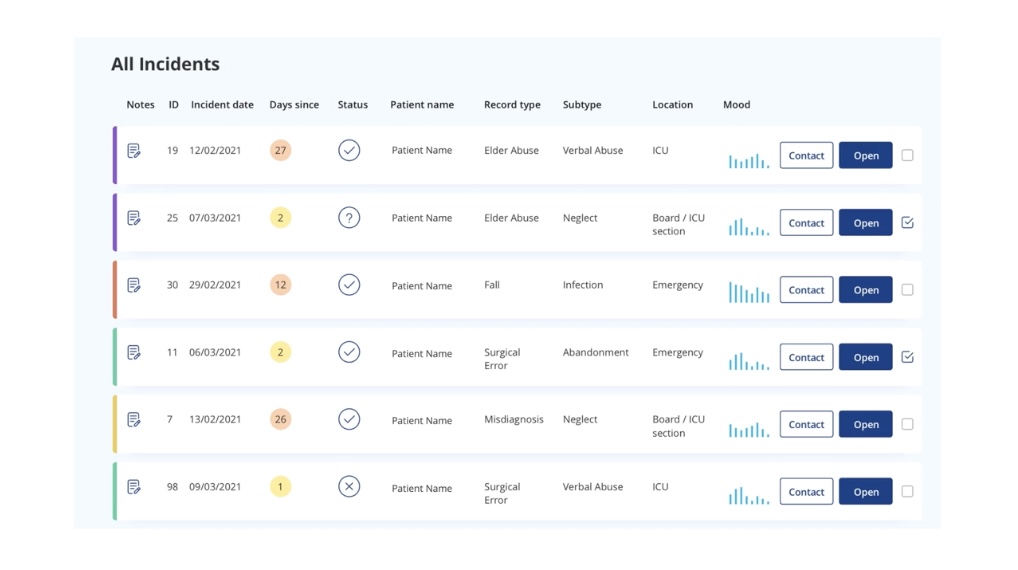
These results would import it as a real-time sparkline which allows the end-users on a platform to quickly understand the trends. They can choose to either reopen incidents or contact the patients directly.
Now, when this was shown to the CEO in the design phase, he remarked that this would save lives. End-users now have insights that they didn't have before in real-time. Now, when they viewed a patient incident later in the workflow, contextual analytics provided them with more information to better guide how these actions should be taken.
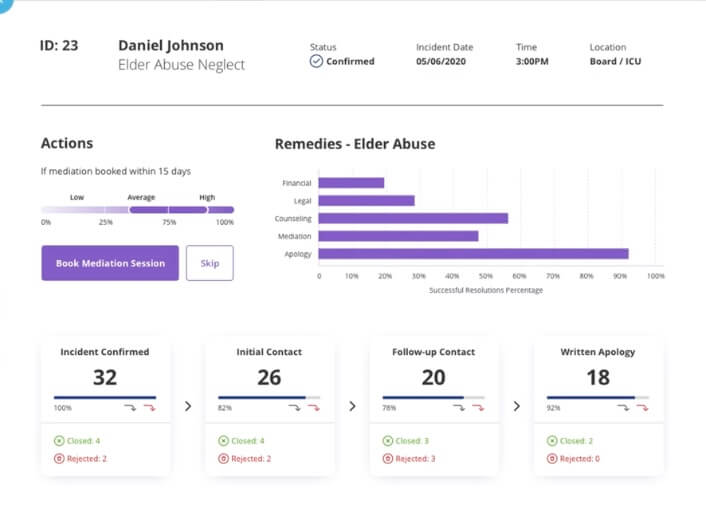
Based on all the cases of the same type, the analytics recommended that in this case, an apology was the best way forward. What the end-user sees in his workflow may change over time as different actions lead to different outcomes.
Whatever that is, it is immediately available to them when the end-user is at the point of consumption. This is really at the point of making informed decisions.
Here's another fascinating example.
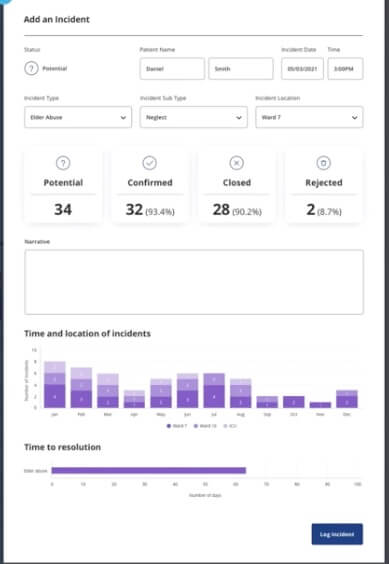
Instead of your usual form, where you simply input data into an incident, the person raising it is provided additional analytics around wards. This forms part of the form and updates according to the chosen drop-down value.
We're showing them key metrics on the time and location of incidents. All of this is possible through embedding analytic content inside key user workflows.
Key takeaways
If you're thinking of implementing contextual analytics within your products, then there are a few key considerations.
1. Gauge your product and organization on the embedded analytics maturity curve. To get the implementation right is critical to identify where you're at and address the areas where you may need to improve your product analytic capability. You need to get this right before even embedding any kind of analytics.
2. Invest in your data layer. Nothing is worse than embedding analytics into your products for your end-users, but I'm sitting here waiting for a chart to load. There are plenty of database technologies out there today which can immediately resolve that in terms of speed.
3. Consider the opportunities for embedded analytics. To introduce better analytics, you need to ensure that the analytics can be embedded in a really granular fashion to your requirements.
4. Empower the subject matter experts. Get your data heroes in the organization to tell the data stories and share them with the rest of the organization. Data stories that provide really the context behind the numbers. The more you can do that with the platforms and tools given to them, the better we will be for the business moving forward.


Become a PLA Insider
Thank you for subscribing
Get exclusive insights, frameworks, and strategies from product leaders driving real business impact.
An email has been successfully sent to confirm your subscription.
 Follow us on LinkedIn