


Why are metrics important in product management?
In simple terms, metrics allow you to measure your business’s health. But there are a few important reasons why you need to stay on top of them.
Firstly, product management KPIs keep your business focused on performance and growth. When you look at data, you can see where your business is dragging and can identify changes that need to be made. Metrics give you specific goals to tailor your business plan for success.
Secondly, metrics give you accountability by setting targets. When you know what goals you’re trying to achieve, keeping everyone on track to hit them becomes a lot easier. Plus, you can improve your team’s morale by keeping those goals realistic and based on hard data, rather than pulling numbers out of thin air.
Thirdly, metrics give valuable insight into good decision-making. By understanding trends and how to use the market to your advantage, data can inform strategic planning. Rather than throwing things at the wall and seeing what sticks, data allows you to target your approach with the best knowledge to make data-driven decisions.
Michael Pierce, Director of Product Management at Public Consulting Group, shares his opinion on why product-led growth metrics are so important for product teams:
“Metrics can act as an early warning system.
“They may highlight a part of your product that doesn’t work for your customers. It can be easy to take momentary success for granted, but markets change, and so do the needs of your users.
“Measuring KPIs can allow you to change course when you need to by providing you with the science behind the curtain.”
Metrics vs KPIs vs OKRs
Before we dive into the details of what metrics your product team should be tracking, it’s important to understand the subtle differences between metrics, key performance indicators (KPIs), and objectives and key results (OKRs).
Key definitions:
- Metrics: Quantifiable measurements that track specific activities or outcomes.
- KPIs: Metrics that are tied to business or department goals that monitor individual or team performance, usually tracked regularly.
- OKRs: A framework for setting ambitious goals and measuring progress. These could be business goals or department goals, the key is that they’re often more ambitious than KPIs.

Selecting your North Star metrics
Nikhil Varshney, Platform Product Manager at Wayfair, defines North Star metrics (NSM) as:
“The only unifying element that binds the teams involved in the launch of a product. It serves as a framework that aligns the language of the customer, product, and business, ensuring cohesive communication and effective execution.
“The north star metric is a leading indicator, connecting the product to broader business goals. A good NSM captures the customer and value delivered to them, and highlights the business strategy.”
Nikhil suggests these three steps to find your team’s north star metrics:
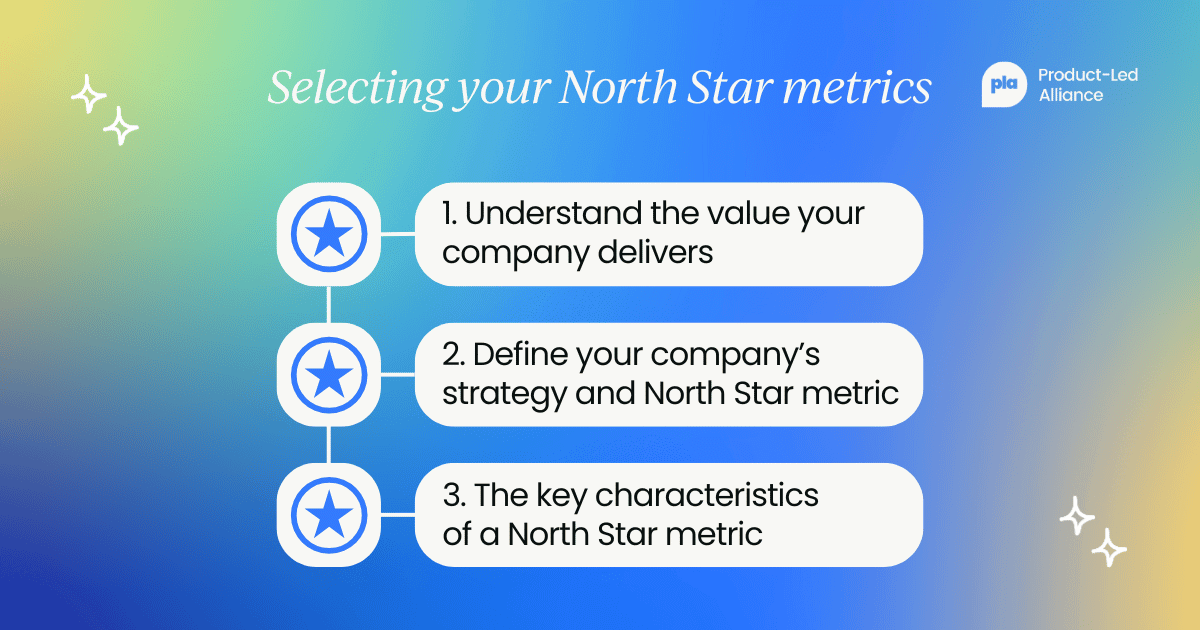
Understand what value your company delivers to its customers
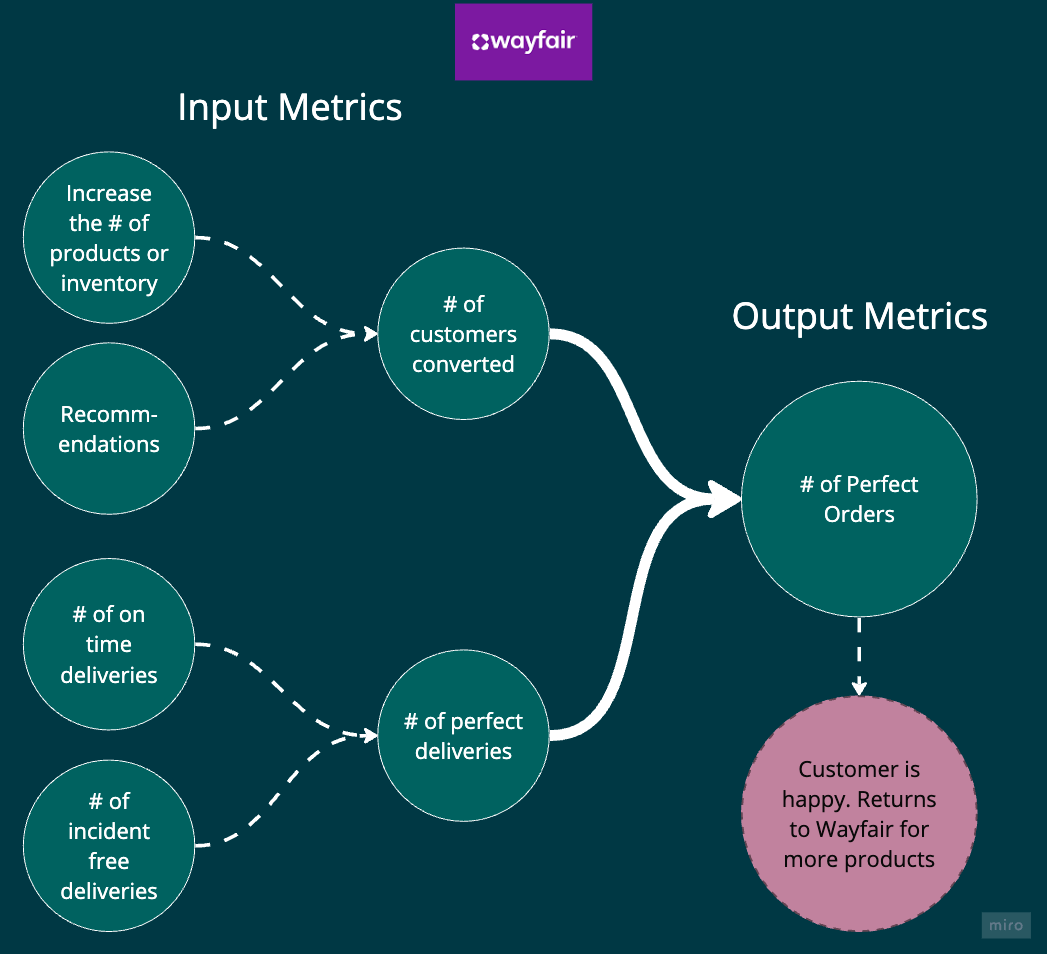
“At Wayfair, our focus is on delivering the 'Perfect Order' experience to our customers, which is a combination of top-notch products, seamless shopping, and flawless delivery. While revenue is important, it's a result of our commitment to excellence.
“When customers have a perfect experience, they tend to buy more frequently. The figure below illustrates how I've utilized various input metrics to calculate an output metric, showcasing the value Wayfair provides to its customers, i.e., ‘perfect orders’.”
Define your company’s strategy and North Star metric
“As a home furnishing company, Wayfair's revenue generation hinges on providing customers with a perfect order experience, encouraging them to return for future purchases.
“Data plays a pivotal role in shaping Wayfair's business strategy. By analyzing input metrics that contribute to the single north star metric (figure 1 above), we gain insights into the underlying factors driving our platform's success.
“This approach informs company-wide initiatives, guided by the products developed by PM teams. The figure below illustrates how your work influences the company's north star metric through:
- The initiatives you drive,
- Organizational KPIs you impact and,
- The business outcomes your product enables.”

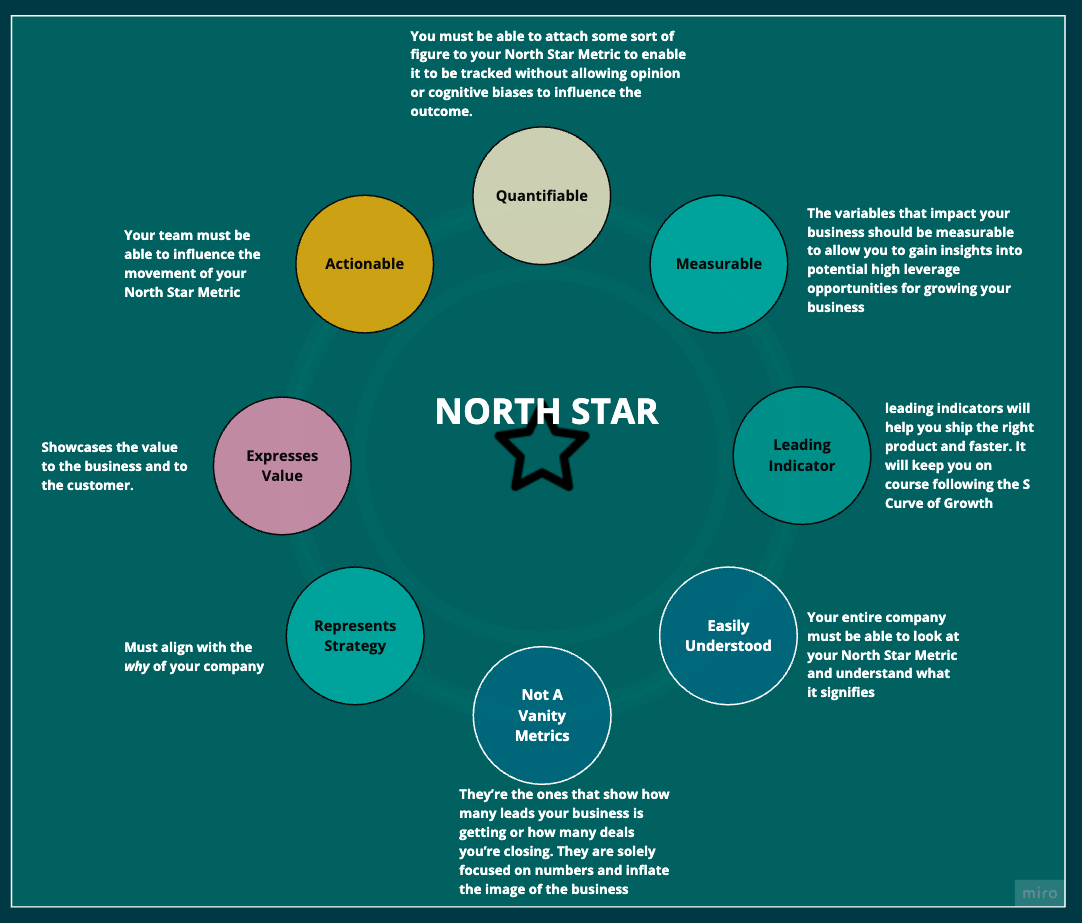
The key characteristics of an NSM
“Unlike other metrics, north star metrics adhere to specific principles that define their effectiveness.
“I've provided a framework or checklist for reference when determining your NSM. This framework serves as a guide to ensure that your North Star accurately reflects the desired outcomes.
“While there is ample material available online to delve deeper into these characteristics, this checklist offers a starting point for crafting a meaningful NSM.”
Designing KPIs for product teams
Crafting meaningful KPIs can be challenging. Srinath Kotela, Senior Product Manager at JPMorgan Chase, shares his simplified guide to creating effective KPIs:
- Understand business objectives: Begin by clarifying your business goals and understanding how your product supports them.
- Determine product focus areas: Identify crucial product aspects that drive your business objectives. For a social media app, this might include user acquisition, engagement, retention, and revenue.
- Set specific metrics: For each focus area, define clear metrics. For instance, for user acquisition, the metric might be the number of new users.
- Craft aligned KPIs: Develop KPIs that resonate with your metrics. A KPI example could be aiming for a 10% rise in new users over the next quarter.
- Review and refine: Continuously monitor your KPIs, adjusting them as necessary to ensure they remain relevant and aligned with your goals.
Michael Pierce shares his advice for choosing your KPIs:
“The type of performance metrics you choose to use depends on the type of product or service you’re offering. It also matters at what stage of development your product is in.
“For your metrics to be meaningful, they need to be actionable, as well as auditable, and accessible. Your data will do nothing without you.
“Once you analyze the results of measuring your KPIs, you want to use this information to tweak your product to drive more adoption and higher customer satisfaction levels.”
Creating SMART product management KPIs
Earlier, we touched on the importance of setting realistic goals for your product team. The best way to achieve this balance? By using the SMART approach to goal setting:
Specific: Specific KPIs are focused on reducing misinterpretation. They are straightforward so that everyone can act on them without confusion.
Measurable: You want data that’s presented in qualitative forms. Think numbers and percentages, which are easy for everyone to read and understand.
Achievable: Are the goals you set from the data collected attainable? Can your employees work towards them feasibly?
Realistic: Are the KPIs suitable for your business growth?
Time-bound: KPIs that reflect a certain time period for your goals.
Ensuring your team’s KPIs are specific, measurable, achievable, realistic, and time-bound helps to keep your product managers rallied around the same objectives and motivated to achieve their targets.

Customer acquisition metrics
1. Product Qualified Lead (PQL)
The purpose of product-led strategies is pretty simple: attract customers through your product offering. The best way to measure this result is by tracking the number of product-qualified leads (PQLs) entering your pipeline.
PQLs are users who’ve tried your product using a freemium version or free trial and have met certain criteria that’s flagged them as a likely customer.
Generating PQLs helps your sales team close more deals and generate revenue, especially as PQLs are up to 10x more effective at converting to revenue than marketing qualified leads (MQLs).
2. Customer acquisition cost (CAC)
Customer acquisition cost (CAC) monitors how much it costs to acquire a new customer. This includes marketing and sales resources and salaries, as well as any other costs associated with acquiring customers.
To calculate your CAC, use this formula:
CAC = Total sales and marketing spending / Number of new customers
While it’s important to monitor CAC, it’s more important to put this metric into perspective by comparing it to customer lifetime value (see metric 18 on our list). This comparison allows you to see if you’re spending too much on acquisition (in comparison to the revenue your customers are bringing in).
For example, a high CAC isn’t a problem itself, but if paired with a low customer lifetime value, you’ll quickly go into the red.
3. Cost per acquistion (CPA)
Cost per acquisition measures the cost of acquiring a new potential customer. This could be a webinar registration, a freemium user, or an account activation.
This metric (alongside CAC) helps with budget allocation and measuring the success of marketing efforts.
4. Conversion rate
Conversion rate keeps track of how many users complete a desired action. This could be signing up for your newsletter, downloading a whitepaper, becoming a free user, converting to a paid subscription, or anything else you’d like to track.
Calculate the conversion rate by dividing the number of people who took the action by the total number of people who saw the call to action/page.
For product managers working on freemium products, the conversion rate from free to paid membership is super important for understanding your product’s value to users.
Monitoring conversion rates can also help to identify sticking points within the customer journey, so you can optimize customer experience across the entire customer lifecycle.

Activation metrics
5. Time to value (TTV)
Time to value (TTV) measures the amount of time it takes users to realize the value of your product and achieve the objectives they set out to accomplish. Ideally, users should find value quickly to avoid dissatisfaction and churn.
TTV can help you streamline your onboarding process so users can quickly get to grips with your solution and achieve their goal. Monitoring where customers drop off can also provide valuable insights into which areas of your onboarding process could be improved.
6. Feature adoption rate
Feature adoption rate measures the percentage of users who start using a new feature during a certain period after its release. This helps product managers understand how well new features are being accepted by users and integrated into their routines.
The formula for feature adoption rate is:
(Feature monthly active users / Monthly logins) x 100
A poor adoption rate could mean your feature missed the mark and doesn’t solve the problem you set out to fix. Or it could simply mean that users aren’t aware or informed about the new feature and how it can help.
Feature adoption is a major predictor for retention, so it’s important to monitor this metric after each release.
7. Activation rate
Similar to TTV, activation rate looks to monitor when user get their “aha” moment with your product as they realise its value. But instead of measuring the time it takes users to see this value, activation rate monitors how many of your users have reached that point.
You could calculate this by dividing the number of activated users by the total number of users.

Engagement metrics
8. Daily active users (DAU) and monthly active users (MAU)
Daily active users (DAU) and monthly active users (MAU) are exactly what you'd expect: the number of users who are active on your platform on a daily or monthly basis.
This regular activity allows you to get a better understanding of how active and engaged your users are, which can, in turn, predict retention.
Think about it – if your users use your software daily, it's likely built into their habits, workflows, and routines. Making it that much harder for them to consider leaving.
DAU = number of unique users who’ve logged at least once in the last 24 hours.
MAU = number of unique users who've logged in at least once in the last 30 days.
You can also track average MAU and DAU to get a more general idea of your user base.
9. Feature usage
Feature usage monitors how frequently users make use of a certain feature in your repertoire. This usage data can help product managers identify the most valuable feature for users and prioritize similar features.
Plus, you may be able to dive deeper into usage trends and customer data to identify and group usage patterns into user personas. Which, in turn, can help with personalization and user targeting.
10. Session length
Session length measures how long your users spend on your platform per session. Longer session lengths can indicate users are engaged with your platform, while super short sessions may indicate users are bouncing off your platform quickly, meaning they're less likely to achieve their goals.
However, increasing session time isn't always necessarily a good thing, as it could also indicate users are confused or having trouble using your software.
That's why it's important to consider session length along with customer feedback and other engagement metrics.
11. Session frequency
Session frequency measures how often your users log in to your software. This can help you to identify your product’s power users and, in turn, understand user behaviors.
Again, this can be used to inform personalized messaging and buyer persona information.
Retention metrics
12. Customer churn rate
Customer churn rate measures the number of users who’ve stopped using your product over a period of time. A high churn rate may indicate an issue with your product that needs to be resolved to retain your customers.
Therefore, it’s important to monitor churn and take action based on churned users' feedback. For example, users may find your new UI difficult to use, or discover that your competitor offers a similar experience at a lower price point.
To calculate churn, use this formula:
Customer churn rate = (Customers lost / Total customers) x 100
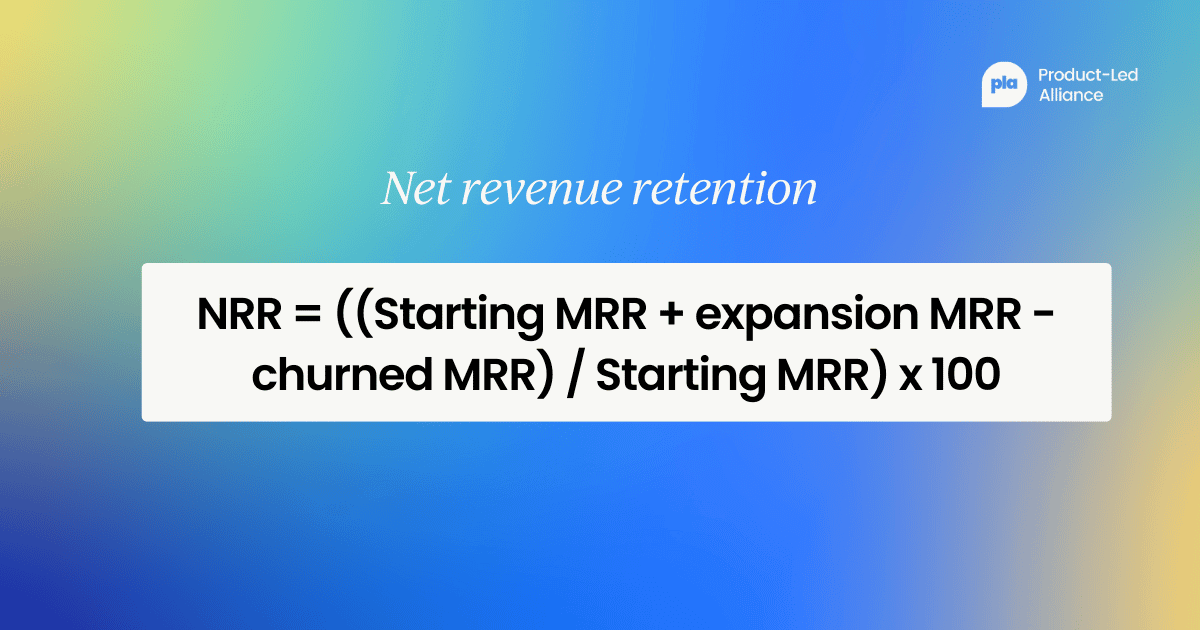
13. Net revenue retention rate (NRR)
Net revenue retention rate helps you to understand how revenue from your customer base you’re retaining over a period. This allows you to understand if you are keeping your customers, or if they are downgrading their accounts or leaving after a few months.
The formula for NRR is:
NRR = ((Starting monthly recurring revenue (MRR) + expansion MRR - churned MRR) / Starting MRR) x 100
Note: You can also monitor the customer retention rate, which looks at the number of customers lost rather than revenue lost.
14. Customer satisfaction score (CSAT)
Customer satisfaction scores (CSAT) help product and customer success teams understand how satisfied customers are with the product. Or you can go more granular and assess user sentiment across specific features.
Typically, these scores are captured using short one-click questionnaires, particularly after product onboarding, where users can submit their feedback on a scale (eg, 1–5 or 1–10).
User sentiment from this feedback can inform product strategy and allow insights into users’ most valued product features.
15. Net promoter score (NPS)
Net promoter score (NPS) is your ticket to word of mouth marketing – essentially, this metric tracks how likely your users are to recommend your product to others.
High NPS is a key ingredient in successful product-led growth, especially in the early stages. Many companies (like Slack and Clay) got their big break through WOM and promotion from happy customers.
Monitoring your NPS allows you to make the most of your advocates and benefit from the buzz of your user base.
16. Customer effort score (CES)
Customer effort score (CES) measures how easy it is for users to interact with your product, whether it’s completing a task, resolving an issue, or finding what they need.
The idea is simple: the less effort users have to exert, the more likely they are to stick around.
CES is also gathered through surveys. These ask users to rate how easy it was to complete a specific action, for example, making a purchase, setting up an integration, or getting help from support.
To calculate your CES, use this formula:
CES = Sum of all scores / Total number of respondents
Tracking CES can help you pinpoint friction in the user experience (and resolve it). For instance, if users report difficulty finding a key feature or navigating your onboarding flow, that’s a clear signal to refine that part of the product.
CES is a go-to metric for improving product usability and ensuring your team is building experiences that truly support user success.

Revenue metrics
17. Monthly recurring revenue (MRR) and annual recurring revenue (ARR)
MRR and ARR are important revenue metrics for subscription-based products or services. These metrics track recurring revenue from your users on a monthly or yearly basis.
Since this revenue comes from subscriptions customers have signed up for, it’s relatively stable and predictable, but can go up and down based on customer acquisition and churn.
MRR = Sum of current monthly subscriptions + Revenue from new subscriptions + Upgrades - Downgrades - Revenue from churned customers
ARR can be calculated the same way, but replacing monthly subscriptions with annual subscriptions and adjusting your predictions to align with this timeframe.
18. Customer lifetime value (CLV)
Customer lifetime value (CLV) predicts the value of a customer over their entire lifetime with your company. This means assessing how much revenue they’ll generate before cancelling their subscription.
This metric helps product teams understand the value of each customer over the long term, making customer retention and satisfaction seem all the more important.
Calculate CLTV by multiplying average customer lifetime by average revenue per user (see the next section for more details on ARPU).
As mentioned earlier, CLTV is also monitored against CAC to ensure customers are profitable long-term.
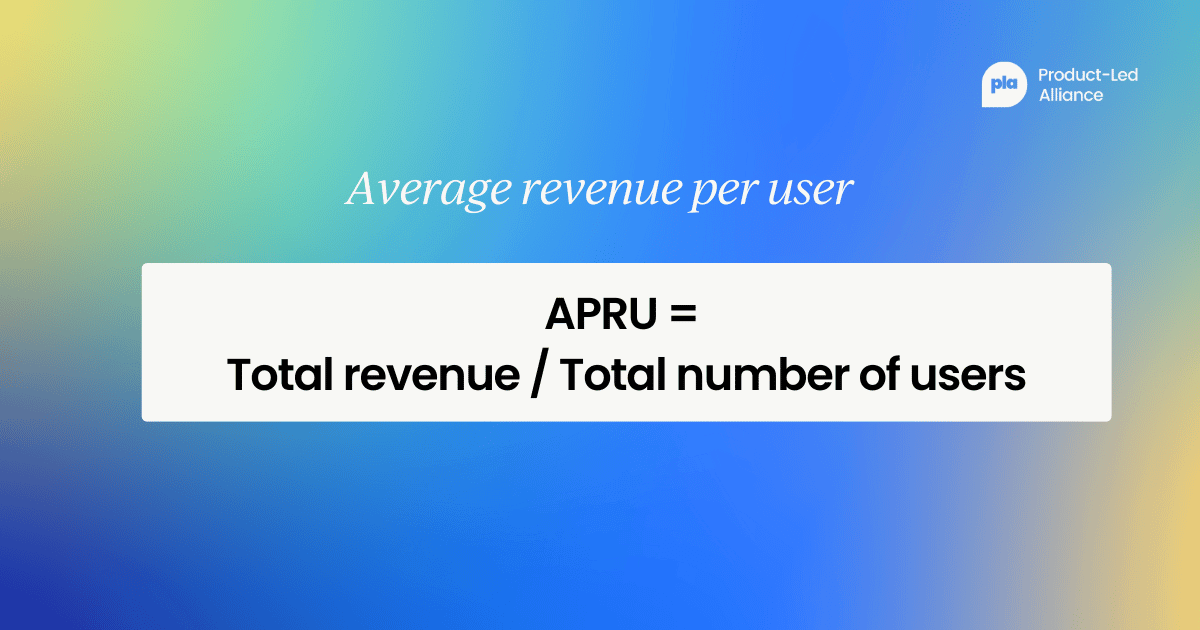
19. Average revenue per user (ARPU)
ARPU monitors, well, the average amount of revenue your company generates per user over a specific period. This metric takes into account all revenue sources (not just subscriptions) to provide a detailed insight into the average value of your users over a certain timeframe.
To calculate ARPU, use this formula:
APRU = Total revenue / Total number of users
Product optimization metrics
20. Time to market
Time to market measures the time it takes your product management team to develop and launch a new product or feature. This includes the entire product development cycle.
This metric keeps an eye on product managers’ outputs and progress towards new features, so while a quick time to market doesn’t necessarily equate to revenue, it can indicate smooth product processes and quick iteration towards an optimized product.
21. Defect density
Defect density tracks the number of errors or defects in your product’s code or UI compared to the overall size of your codebase. The logic is simple: the fewer errors in your product, the better the user experience for your users.
A high density of errors may raise some concerns about the quality of work that’s being produced by your team. This may indicate deadlines are too tight or some of your team need support or upskilling.
Calculate defect density by dividing the number of bugs by the size or complexity of your product’s code.

22. Feedback volume and sentiment
The volume of feedback your product receives should be tracked. A sudden uptick in negative feedback or bug reports indicates something has broken. On the other hand, an uptick in positive feedback may indicate users are finding value in a new feature.
That’s why it’s important to look at feedback sentiment alongside volume. It’ll give you a clearer picture of the thoughts and feelings of your users and ideas on how to improve your product.
23. Escalation rate
Escalation rate measures the number of customer issues that are raised to higher levels of customer support or management. A high escalation rate is another way product teams may discover an issue or bug in their product.
Or you may realise your new feature doesn’t solve customer concerns. For example, if you roll out a new AI chatbot to resolve customer queries, but your customers would rather speak to a human.
Get product-led growth metrics certified...
Start uncovering more of the "why", to help inform the "how" by transforming the way you, your team, and your organization approach measurement and metric development.
By the end of PLG Metrics Certified: Masters, you'll be able to confidently:
- Understand the process to develop measures and metrics that tie cleanly back to core business objectives.
- Measure and demonstrate your team’s success more clearly.
- Provide timely, measured, feedback and focus on impact.
- Produce a flexible deliverable that enables holistic analytics to be infused seamlessly into the product development process.
What are you waiting for...


Become a PLA Insider
Thank you for subscribing
Get exclusive insights, frameworks, and strategies from product leaders driving real business impact.
An email has been successfully sent to confirm your subscription.
 Follow us on LinkedIn