


First impressions count. However, many product builders avoid thinking about it when they work on their products. The importance of first impressions in human communication is easy to grasp. If another person doesn’t like you right away, you have to expend a lot of energy to change that perception.
The same thing happens with digital products. The only problem with this is that you don’t have a second chance to change perceptions. There are ways to reach users outside of your product (e.g. emails or push notifications), but how likely is it that people will read a message from someone they don’t like?
What is user activation in SaaS?
Managing the first impression of a digital product is achieved by working on onboarding. And the core concept of onboarding is activation.
Activation is usually defined as the moment when a user experiences the value of the product for the first time. Some also call this an 'aha' moment - a point at which a user realizes the benefits of your solution and is delighted.
Another concept closely related to activation is time-to-value. This metric is expressed in minutes, hours, or days and indicates the average time it takes new users to experience the value of your product for the first time. The closer it is to zero seconds, the better because people have a limited attention span and are usually not in the mood to search for value as if on a heroic quest.
Examples of user activation
There are examples of activation metrics from well-known companies. These might have changed over time, but if you look at them, you’ll immediately realize why they’re so important.
At Slack, a new account was considered activated when it had sent 2000 messages within a team. Users do not realize the value of a collaboration tool after they have sent a message, but after they have really engaged with their team for the first time. Slack has identified the threshold for the number of messages, and we’ll also be able to identify the primary activation metric later in this article.
At Twitter, a new user was considered activated when they followed 30 users. This is an indicator that users are engaged with the feed. But to read an engaging feed, you need to follow other people.
Why is user activation important for digital products?
A new visitor explores your solution and decides to sign up. There are two possible scenarios:
- A user wants to complete a specific job-to-be-donenot-activated they think your product is fit to perform.
- A user wants to explore and evaluate the solution (more typical for B2B).
In the first scenario, they are looking for the shortest, most accessible, least demanding way to fulfill their JTBD. Of course, they might have additional requirements to use the product long-term, but that‘ll happen later in their journey.
In the second scenario, they want to check how the solution will do their job-to-be-done, but first and foremost, they’re on a data collection mission. They’ve a set of decision criteria that they’ll use to select the most suitable solution.
Regardless of the scenario, the main thing is clear: unless your new users don’t realize how to extract your product's core value, they won’t pay you or use your solution.
A not-activated user is a user that cannot be retained and is immediately lost.
How to identify the primary activation metric
If you haven’t yet defined an activation metric, if you have defined it without research, or if you think you need to update the definition of your activation metric, read on.
There are three steps to identifying the activation metric:
- Analyzing the data to find out what correlates with a target action (either first payment or retention on day/week/month X).
- Conducting user interviews to understand the decision drivers for selecting a solution in your category, the 'wow moments' in terms of features, and the key benefits (expected and achieved) from your users' perspective.
- Synthesizing the findings in a CJM to get a complete picture.
How to use quantitative research to identify primary activation metric
We’ll start with the quantitative side to create better hypotheses for the qualitative part and to come into the analysis without any bias that interviews might introduce.
The main outcome of this step is creating a prioritized list of events (and their respective volumes) that predict or correlate with a target event. For example, a target event could be a first payment or customer retention on day/week/month X, depending on the business model.
The Critical Success Index is the easiest to understand.
To go deeper, research other methods such as the Weight of Evidence/Information Value approach, Feature importance of the Random Forest, Predictive Power Index, and Correlation can be used to assess the correlation or predictiveness of an event to the target event.
To use these methods successfully, you need either a product analyst or basic SQL knowledge to export the data.
Caution: With small sample sizes, conclusions may not hold up over time.
The Critical Success Index approach
The Critical Success Index approach is the simplest and is based on the basic concept of overlapping sets. We look for the greatest overlap between an event and its volume with the target action. Then we use the score to evaluate the predictive power of one variable to another.
For this approach, you need to extract data that includes:
- User ID.
- A binary column that refers to the target action - whether the user purchased or was retained (completed target action).
- A series of binary columns for each potentially relevant event in your app and the number of times it happened to the user.
- A user can only be assigned to one column. For example, if the user has completed an action three times, they should only be listed in the '3 times [event] completed' category, not the '2 times', '1 time' or '0 times' category.
Which events should you select for data export? There are two possibilities:
- Build hypotheses based on your understanding of the value of the product and export only events that relate directly to core actions.
- Export each event and run several rounds of analysis to refine the activation definition.
The resulting dataset will look like the figure below.

One caveat at this stage is the period of the data you will use. For example, if your product has changed a lot over time and older cohorts couldn’t use a particular functionality, you need to either exclude older cohorts, and newer events relating to that functionality, or choose a time period when all users could use all events. In other words, you shouldn’t treat unavailable data as '0' (user not completing action) as this would distort the research result.
To do the calculations, you must create a table for each event. We will need four categories:
- Did action and converted (retained)
- Did action and did not convert (retained)
- Did not do action and converted (retained)
- Did not do action and did not convert (retained)

This table describes all new users who have completed the 'Catalogue Opened' event only once.
The next step is to calculate the ‘Aha score’. You need to divide the number of users that did the action and converted by a sum of those who did the action and converted; did the action and didn’t convert; didn’t do the action and converted.
In the example above, the Aha score is 0.126 (or 12.6%). In this example, we cannot say whether it’s high or low because we need to compare it with other events (and Aha scores for different volumes of that event).
The higher the percentage, the more likely it is to be your activation metric. Do the same calculations for all events and their volumes, and you’ll see which events best predict the target action.
The most similar approach is the Weight of Evidence / Information Value used in credit scoring. WoE/IV is the best suggestion after the Critical Success Index if you want to get a little more involved with data.
Qualitative research to identify primary activation metric
User research helps you connect the story that the data describes with the perspective of the people who use your product. It's easy to feel like you have done your job after a quantitative analysis. After all, you know your product very well. However, user research is a necessary balancing step you need to take before setting a target for activation.
This is mainly about discovering what experiences have led users to recognize the value of your product. The suggested methodology is interviewing. It allows you to get as much context as possible and go in-depth in your research. Other methods of qualitative research will give you less information.
Target audience
You must focus on users who match your ICP (Ideal Customer Profile) description to get relevant results. For products with multiple target audiences or sub-products, you may need to conduct the research separately - both qualitatively and quantitatively. Otherwise, you’ll get mixed signals that do not show a clear pattern.
The main criteria for including users in these interviews are the following:
- Match the description of your ICP.
- Completed target action (first purchase or retention on day/week/month X) within the last 14 days.
The second condition is given because you must talk to people who still remember their first experiences. With time, the original experience blurs and merges with the knowledge acquired later.
Key pillars for the research
There are three central pillars that you will deal with:
- Job-to-be-done (JTBD) or a use case
- Aha moment
- Decision criteria
These three parts are excellent for the CJM you’ll create as a result of your research on activation.
The first part is about learning more about the job-to-be-done the end user has come for. Without going into more detail about JTBD theory, the main idea is to recognize that users hire your product to achieve a specific outcome. Your activation moment should fulfill the JTBD or, in a complex product requiring extensive setup, at least show what a fulfilled JTBD will feel like.
Knowing the user's JTBD is also helpful in understanding their context and mindset, as it allows you to tailor your activation experience to their expectations.
An aha moment is usually described as a sudden realization that your product delivers a certain value to the end user. While we can proactively design aha moments, what is important is what an end-user perceives as an aha moment in your solution.
The aim is to find out what specific experiences, benefits, or features made the user feel comfortable with the product for the first time.
And the third part is about the decision criteria. When choosing one product among many in the category, people have criteria by which they choose a product. These criteria can be implicit or explicit, but they guide as to which solution is best. Ideally, your product and positioning should reflect the decision criteria of your ICP. We need to understand which decision criteria are most important for activation.
To make your job easier, if you don’t have access to a product researcher, use the suggested sample questions for each category.
For the Jobs-To-Be-Done part, consider these questions:
- Why did you look for a product like ours?
- How did you find the product?
- What were your expectations of this product?
- What did you want to achieve by using this product?
For the Aha-moment part, consider the questions:
- How did you explore our solution?
- What made you decide that you would like to buy (continue using) this product?
- What was your first impression of the product?
- Please describe your first session with the product.
- What features were most important to you?
- What was made possible for you by using this product?
For the Decision Criteria part, consider these questions:
- How did you compare different solutions in this product category?
- What made our solution better than the second-best solution you evaluated?
- What was the second best solution good at?
- What concerns did you have about the product?
- Who made the decision to buy the product, and what did they contribute?
Synthesizing quantitative and qualitative insights
At this point, you have qualitative and quantitative data to define your activation metric. Once you have all the data, you’ll want to draw conclusions immediately, and in most cases, you won’t be wrong.
However, instead of immediately selecting a metric, create a short customer journey map that reflects the customer's path to the purchase decision (or establish a habit of continuous use, depending on your target action). The key point here is that optimizing around the activation moment is not enough – your work on activation should start much earlier than sign-up.
There are many representations of a customer journey. Some create non-linear schemas that map all possible paths your customers may take. Others opt for a linear model that has a progression.
For this analysis, I propose a linear approach. In its simplest form, your journey map is a table with columns referring to each step and rows representing categories describing that step.
Mapping the steps
Use information from the interviews to outline the steps. In your interviews, you should obsess over each step a customer goes through, from the first thoughts about a possible solution to the purchase (or habit).
There are two main problems you will encounter:
- Minor variations that relate to the same action.
- Different steps for evaluating a solution.
The first problem happens when the high-level stage is the same, but the actual way the customers did something differs across multiple interviewees. For example, people will tell you about their initial step: some googled, some used bing, and others went to G2 or Capterra to start with reviews. This step can be collapsed into ‘Research’ even though the specific way the customers did research is different. You’ll note that later when describing each step.
The second problem arises when there are multiple ways to explore your product. There’s no ideal way to solve it when we are trying to generalize from specific cases. However, you should still see the patterns. Use the pattern that arises most of the time, and write in the description of this step that some users prefer to do a different action.
If you have two or more competing patterns, you may need to create two different CJMs. That’s your clue that you may have two or more segments of the audience with different decision criteria and use cases. In this case, you should also do your quantitative analysis separately.
Describing the steps
The categories that describe the steps will depend on your solution, but some categories can be universal. I suggest using at least those categories:
- Context
- Goal
- Emotional state
- Relevant decision criteria
- Relevant predictive actions
The context helps you understand how much attention you are getting from the customer at each step. This category is intentionally broad because it allows you to capture general patterns related to the step. The context might reveal the specific mindset of your customers at the step, where they’re doing these steps, what device they are using and what interactions they have with others at the step (or as related to it).
The goal describes what the customer wants to achieve at that step. You should make it as precise as possible. It’s okay to write things like "I wanted to explore feature A in this step" if that was the client's goal.
You should elicit the emotional state at each step when doing interviews. People don’t go through interfaces like robots. There will be points in the experience where they feel most curious or happy, and this information can help you guide your onboarding.
The relevant decision criteria will help you tailor the steps to specific values important to the customer. If you need to cover several different decision criteria to be selected by the user, you should know when the evaluation for each criterion takes place and adjust your experience accordingly.
The relevant predictive actions come from the quantitative research you have conducted. If you have suitable predictive actions that don’t fit the CJM, review your entire journey map to see if it covers each critical step.
Selecting the activation metric
You’re now in a position to make a data-driven decision about what to choose as your activation metric! With CJM, you can talk to the whole team to test the results and agree on the decision for the metric.
The next step would be to track the percentage of new users who take this action relative to all people who sign up. Again, pay attention to the differences between each segment and filter out some segments that have much lower intent than your primary funnel.
For example, with B2B products involving other people, you may have a viral loop (such as SurveyMonkey's prompt to sign up after completing a survey) that brings you many new users. However, their behavior may not reflect your target audience, and including these different segments in activation, calculations will just provide unactionable results.
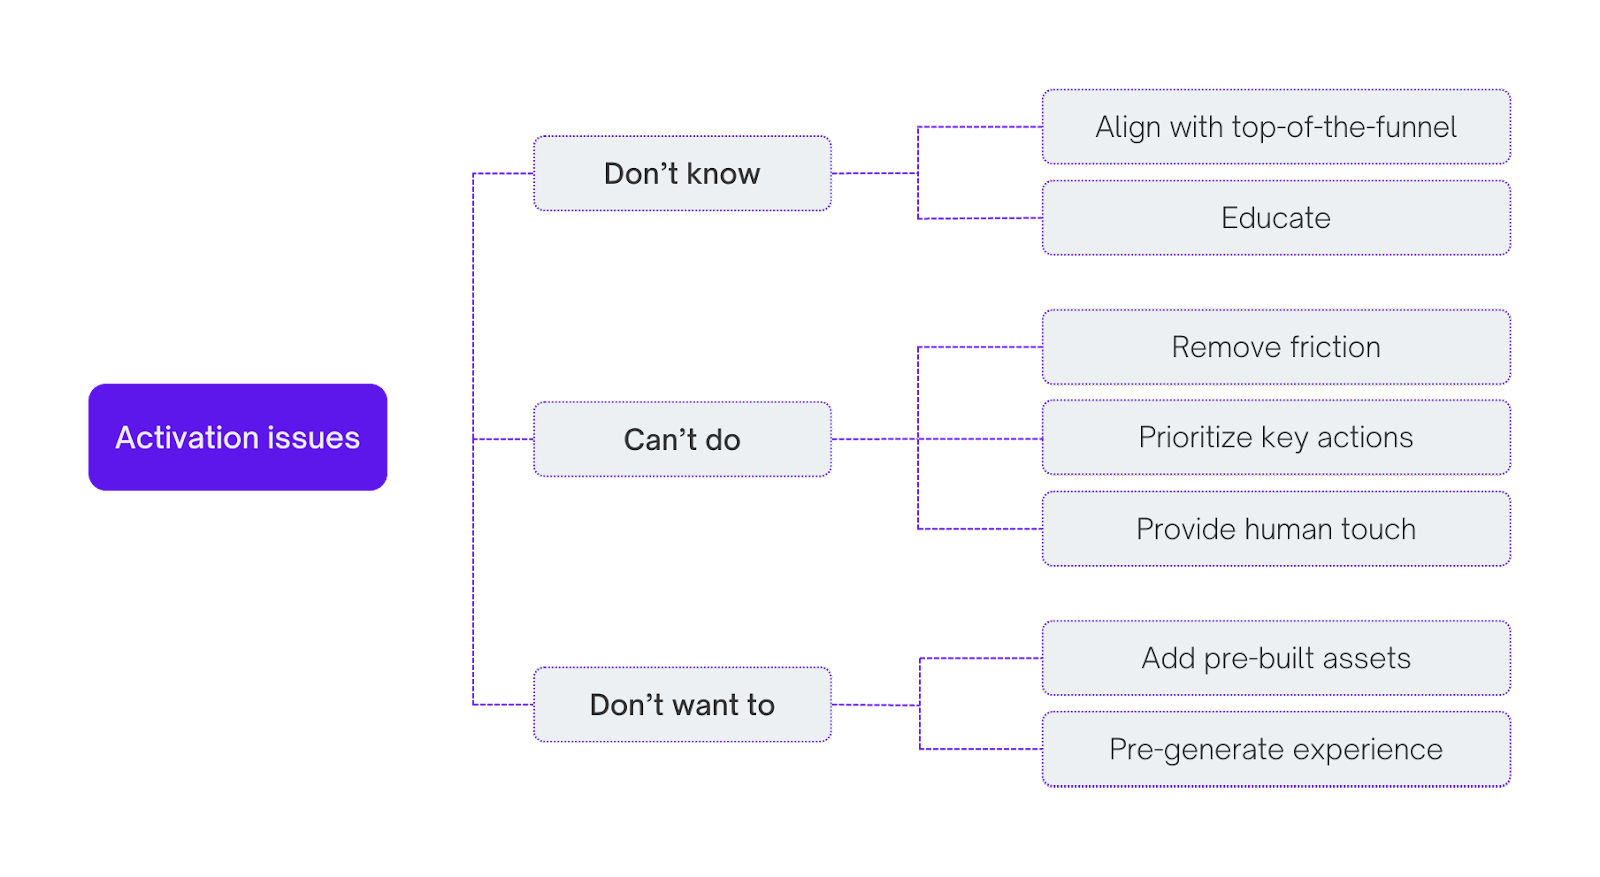
How to optimize the experience for primary activation
There are three basic categories of issues that you should consider first when working on activation: Users do not know how to do the action, users can not do the action, and users do not want to do the action.
The list of issues isn’t meant to be collectively exhaustive, and there’ll be issues outside these categories. In practice, if you invest enough in user research, you’ll find out what specific problems users encounter that prevent them from activating.
Before looking at potential changes in these three categories, consider whether you have an issue and whether the suggested improvements will help in your particular case. Think of this list as ideas to try out, not gospel.
When they don’t know what to do
Using a new product requires a cognitive effort from any person, even a digital native. People download new apps or sign up for new services in different emotional contexts and with varying levels of need for the product. When comparing multiple solutions at the same time, the most cumbersome solutions that do not have clear competitive advantages may be completely ignored if they present too many challenges in the onboarding phase.
New users arrive at your solution with a completely blank slate. They may have heard something, seen a video on YouTube describing your solution, or simply found it without knowing how it works. The first thing they will do is study what your solution offers and only then proceed with the product.
Align the top of the funnel
Since the user's first impression is on a publicly available property, such as your website, you need to match that experience with what the user will see in the product. It is much easier for the user to interact with the product they have just seen in screenshots on the website and whose core benefits (along with relevant features) have been described.
You can align with the top of the funnel by:
- Changing your website to showcase your product more prominently and create expectations about the primary benefits users will get from it.
- Showing your product in ads.
Educate
Most products evolve to grow and introduce additional use cases and features to attract and retain more customers. Unfortunately, while growing feature sets offers the opportunity to gain a larger market share or target a completely different audience, it also creates additional friction for new users who have to work through all the things you’ve created to unlock your core value for the first time.
To mitigate this problem, you can add educational elements to the initial experience, such as:
- Tooltips and tooltip flows related to the core value.
- Instructional videos for the first sessions in a visible place.
- Embedded help content that is immediately accessible.
When they can’t do
New users may feel motivated to learn your tool, but sometimes the friction is just too great - either because of the product itself or because of the skills of your users. If you’re not catering just to a tech audience with your product, some UX patterns may not be easy for your users to recognize. They might have difficulty finding their way around the user interface if they haven’t had previous experience with a similar solution.
Lack of time, skills, a complicated product and other issues contribute to your new user simply giving up on learning your solution.
Remove friction
The first thing you should think of here is eliminating friction. The less friction, the easier it is for the user to extract the value. The dilemma here is that eliminating friction can also detract from the experience itself, especially if the friction is caused by other features that might be relevant enough to the user and their decision criteria.
The key actions you need to take here are:
- Improving core UX continuously.
- Connecting the sign-up with the onboarding experience.
- Removing steps, actions or features from the first session.
The first point is simple: the better UX is, the easier it will be to learn the solution. Continuous usability testing of your initial experience and core flow is beneficial here.
As for the second point, look at Airtable's onboarding process. During sign-up, you enter more information about your business and how you will use the product. The data is used to create your first table, which is tailored to your use case.
Think about the first session. Do you need to show the UI as it is for existing users? Do you need to provide the same experience, or could you walk users through some steps that make it easier for them not to get distracted by all the bells and whistles (progressively disclosing the functionality)? This is a tricky change to make, but it could mean a unique first experience for your audience.
Prioritize actions
You know the steps to extract the core value. Unfortunately, your new users haven’t yet learned this and are searching for it. To make these users successful, you can simply remove the need for them to think about what to do by prioritizing certain actions and tasks for them to complete.
You can try the following:
- Providing a checklist of actions.
- Create or improve empty states.
- Block non-essential elements in the UI.
While the first two suggestions are fairly straightforward, the third means that a user is directed back to the main flow if they explore something that is not helpful at the moment. This may be somewhat controversial because people evaluate solutions differently, and they might be just checking what you offer. However, there’s nothing wrong with you showing them the desired function with a visible prompt to return to the main flow.
Provide human touch
There are statistics on the internet that say that shoppers today prefer to go the self-service route. One can easily misinterpret this statement as a call to only make a self-service motion without any involvement of sales. However, the idea behind this statistic is that you need to offer buyers a way to complete the process themselves and not necessarily discourage them from talking to people in your organization.
Two simple ways you can activate high-value customers with human contact are:
- Chatbots and chats with Sales/CS behind them.
- Entry points to book a demo in the product.
When they don’t want to do
Sometimes people research solutions they may not need at the moment but for which they have a long-term need. For example, some tools allow you to draw diagrams together that visualize processes, structure your thoughts and the like. Visitors may come to such a solution not because they need to brainstorm right now but because they heard a great review of it from their friend.
The solution will lose a sizeable number of visitors in this example after they sign up. The users do not want or need to interact with the interface to get anything done. Given the immediate cognitive load they experience, some will not even try your solution.
Pre-built assets
How do you nudge users who do not have a specific use case right away to get value out of the product after they sign up? Does not that violate the definition of extracting the value?
While the answer to these questions depends on your point of view, pre-built assets can help your users add value even if they’ve only come to evaluate or look at the solution. Instead of creating something from scratch, they can choose a pre-built asset that comes closest to what they may need in the near future or what they did some time ago inefficiently.
The easiest way around the problem is to provide pre-built assets:
- Templates
- Welcome content
- Content suggestions
The example in this section could refer to Miro, a solution that helps you visualize processes, brainstorm together and work as if it were a normal whiteboard. Miro uses templates to significantly reduce the work a new user must do to extract value.
Pre-generated experience
Another solution to the same problem is pre-generated experiences. If the product requires a complex set-up and it is not easy to extract the core value after the signup, there’s still the option of imitating the value that users will extract in the future.
The only problem with this, of course, is whether you can consider a pre-generated experience as an actual activation experience. It’s helpful to evaluate a solution when you see how it would have worked if you had bought it, but you cannot extract the value of the solution.
A pre-generated experience is usually achieved through tours with sample data. Pipedrive, a Customer Relationship Management (CRM) solution, allows all new users to generate sample data. This makes the account, which was previously empty and lifeless, look as if a fictitious company had used it.
Moving from basic activation to holistic onboarding
At this point, the reader should know how to define an activation metric and how to improve it. The latter part, of course, should be driven by your continuous research of the problems new users have with your solution.
At a certain point, however, you’ll find that most improvements (and you will go far beyond the suggestions in this article) have been exhausted. Does this mean you should abandon additional work on the onboarding experience?
Your solution will undoubtedly evolve and require changes to onboarding. However, the main reason is that you can exhaust your options with generic activation enhancements. Still, there is a way to go deeper and provide a more personalized path for different segments.
Activation is just one dimension of onboarding
As defined at the beginning, activation is achieved when the new user extracts the value from your solution. Activation means that the user has understood the core value proposition. For some solutions, this moment will help retain the user. For other solutions, it clearly shows what is in it for them if they buy the solution.
But even if the user can define and extract the core value, it does not mean that the user understands whether the solution is good enough to continue using it or to buy it.
Every new user has decision criteria for choosing a solution. The user experience at all touchpoints, including the website, app store page and onboarding, should consistently provide answers to these decision criteria. Users may not have explicitly defined these criteria, but you can uncover these implicit criteria with qualitative research.
Three-step iterative framework to improve onboarding
To move from mere activation to a full onboarding path, three steps are required:
- Segment user base.
- Identify supporting behaviors and metrics.
- Improve supporting metrics.
These three steps are iterative, and the time you need for one cycle depends on the product. The minimum you need is two full quarters. You can do some of the work in parallel, as the exploratory work can precede the delivery work, but it requires a focused approach and a single-threaded leader that can work continuously to improve onboarding without interruptions or side projects.
Segment user base
New users come in all shapes and forms, and the more established products tend to have multiple acquisition funnels and receive users from companies of different sizes or departments. Typically, these segments show different behavior and may even come to your solution for different reasons.
Onboarding that does not address key differences will cater to no one because it’ll produce an experience suitable for no one in particular.
You can segment by:
- Intent (acquisition funnels, roles).
- Reason to sign up (Use cases, JTBDs, needs, desires).
- Preferences (different demographics/firmographics may have different decision criteria).
Good segmentation will provide audiences that:
- Have different decision criteria.
- Exhibit different behavior.
There is no point in creating segmentation that provides similar audiences as, in this case, there is no potential for personalization in onboarding and better targeting of these users.
Identify supporting behaviors and metrics
The next step is to find what makes it click for each segment to keep or buy the solution.
There are three main ways to do that:
- Consider whether the primary activation metric is still applicable to that segment.
- Find additional engagement or conversion drivers.
- Measure the user experience.
The primary activation metric may not reflect the core value extracted from the product to a specific segment of your audience. To understand if it is valid for any of your segments, you should re-run the analysis described in this article for each segment.
Additional engagement or conversion drivers are essentially the things that had the potential to become your primary activation metric but did not. You should undoubtedly gain insights into these factors from the segmented analysis, not from the initial research you conducted.
For example, you may discover how important collaboration is to one of the segments after the analysis, but your product does not put this at the forefront and the collaboration features are at best an afterthought. In this example, you now know what kind of experience to highlight and bring to the segment
User experience measurements, such as CES, allow you to understand whether segments are equally satisfied when working with your product. For example, some features or processes may be more suited to the skills and knowledge of one segment, while being completely inappropriate for another.
Improve supporting metrics
With so many ways to segment the audience and select supporting metrics, it’s easy to get lost in prioritizing what to work on, how much time to invest and what to improve now.
It is best to select only one type of segmentation and start working on one supporting metric per segment at a time. Discovery should precede the delivery work, and you should have enough backlog to experiment with activation while you explore what to work on next.
One of the consequences of working with segmented or personalized onboarding is the growing complexity of onboarding and its associated features. At some point, you may find that you no longer know what each segment gets as onboarding. That's when you should invest in an internal onboarding platform that assigns components of onboarding to each segment.
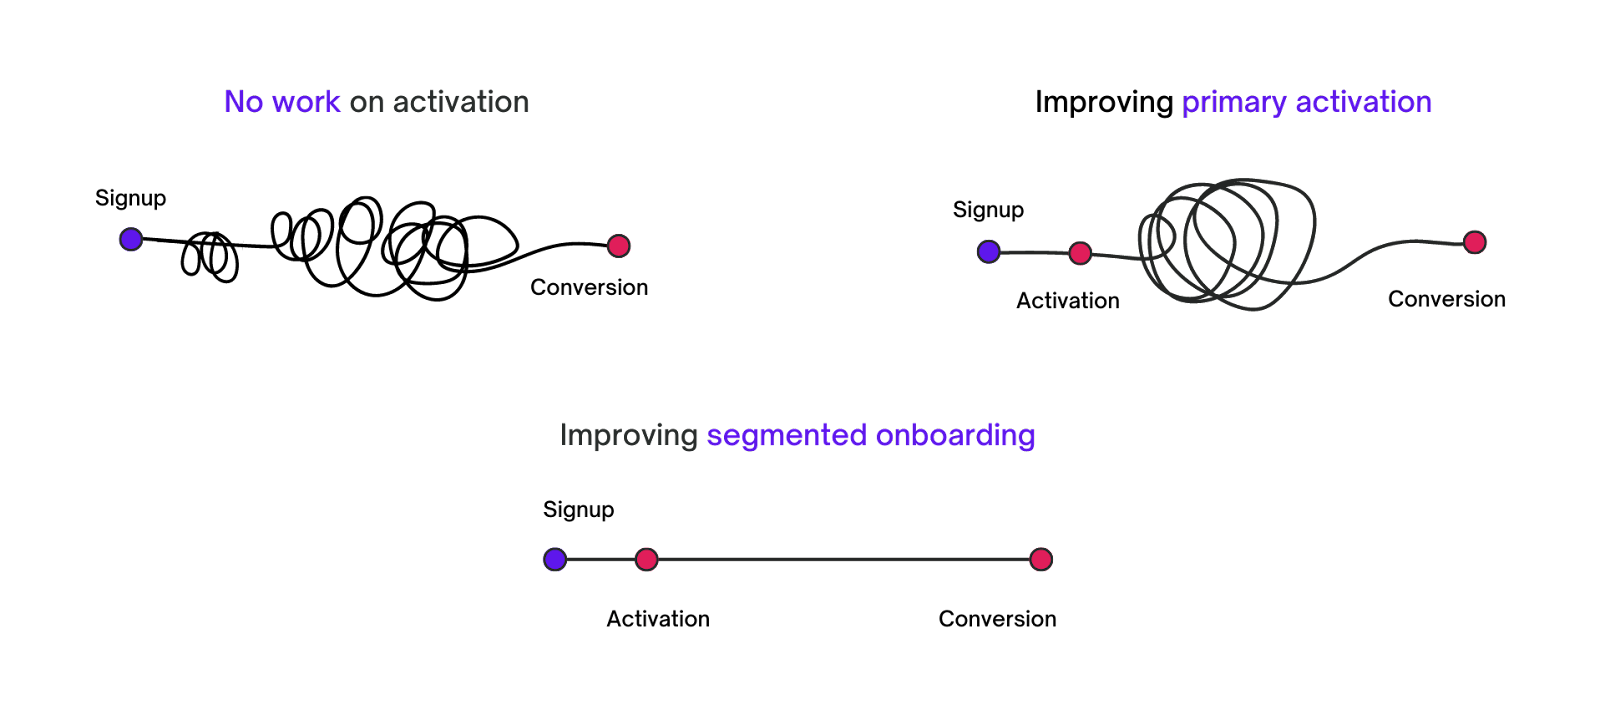
Wrapping it up
A picture is worth a thousand words. Here is a simple representation of what the customer journey can look like, depending on how much effort you put into activation and onboarding.


Become a PLA Insider
Thank you for subscribing
Get exclusive insights, frameworks, and strategies from product leaders driving real business impact.
An email has been successfully sent to confirm your subscription.
 Follow us on LinkedIn