


How do we classify whether or not a page view is engaged?
My name’s Storm Hurwitz, I previously worked at the New York Times as a Senior Analyst in the news product division.
In general I was really on the day-to-day thinking about the article page or story page, whatever you want to call that as a product, and understanding how readers engage with it, what that engagement looks like, helping support product teams etc.
If you're in analytics or products, you're probably aware, this has many different questions within it.
- What is engagement?
- What is a page view?
I could go on and on about it. But I want to take some time in this article to focus on the process I took in getting a new metric put together to answer the initial question above, and share the key learnings that helped me make it a success.
 Rebecca Madro
The challenge
What does success look like?
First, addressing what the broader challenge was. As I said, how do we identify an engaged page view? In this specific use case, there were five general tenants I was holding to, in order to think about what success would look like here.
Descriptive
Often, you'll have a metric you know is super important for success - something like how many active days someone has but it's really hard to move it with testing and feature building.
The idea here is we wanted something that was descriptive, that would ladder up to these metrics we know are super important, but would also be very movable at the product level and at the feature development level.
Scalable
Then scalability, this is going to depend on your given metric you're thinking about, but for something like engaged page view, if you're saying that at the Times, you can imagine folks across the newsroom, folks in marketing, as well as in product are all going to have some sort of buy into what that means.
If they hear it, they're going to want to understand what it means. So really taking a step back to say, "Hey, at scale, as I'm building this, what does this need to look like? How am I building data infrastructure and overall feature use that will enable things to be flexible as it grows and is deployed across the organization?".
Moveable
The next one - moveable, I already hinted at this, but I really want to make sure if you're developing something that's product-focused and you're an organization that relies on testing as we do, it's something you can move and that meaningfully moves.
Iterable
Similar to scalable, your business is going to change over time. If you're looking at something like an engaged page view, the types of things that count as engaged are going to probably change as your story formats change, as your data implementation and tracking changes, as you develop new apps, etc.
So you really want something that can be added on top of, in my opinion, for longevity.
Simple
Also something simple, and I think this is maybe along with descriptive and movable the most important three. You need to be able to explain this to folks across the business.
It's one thing to have a metric that is all of the four things above, but if someone who is not data-oriented at all, can't understand what this is doing and what it's measuring, then it doesn't mean much, because there's probably going to be low buy-in.

Process diagram
This is a general process diagram of putting together a new metric that on reflection, I think is what worked for me.
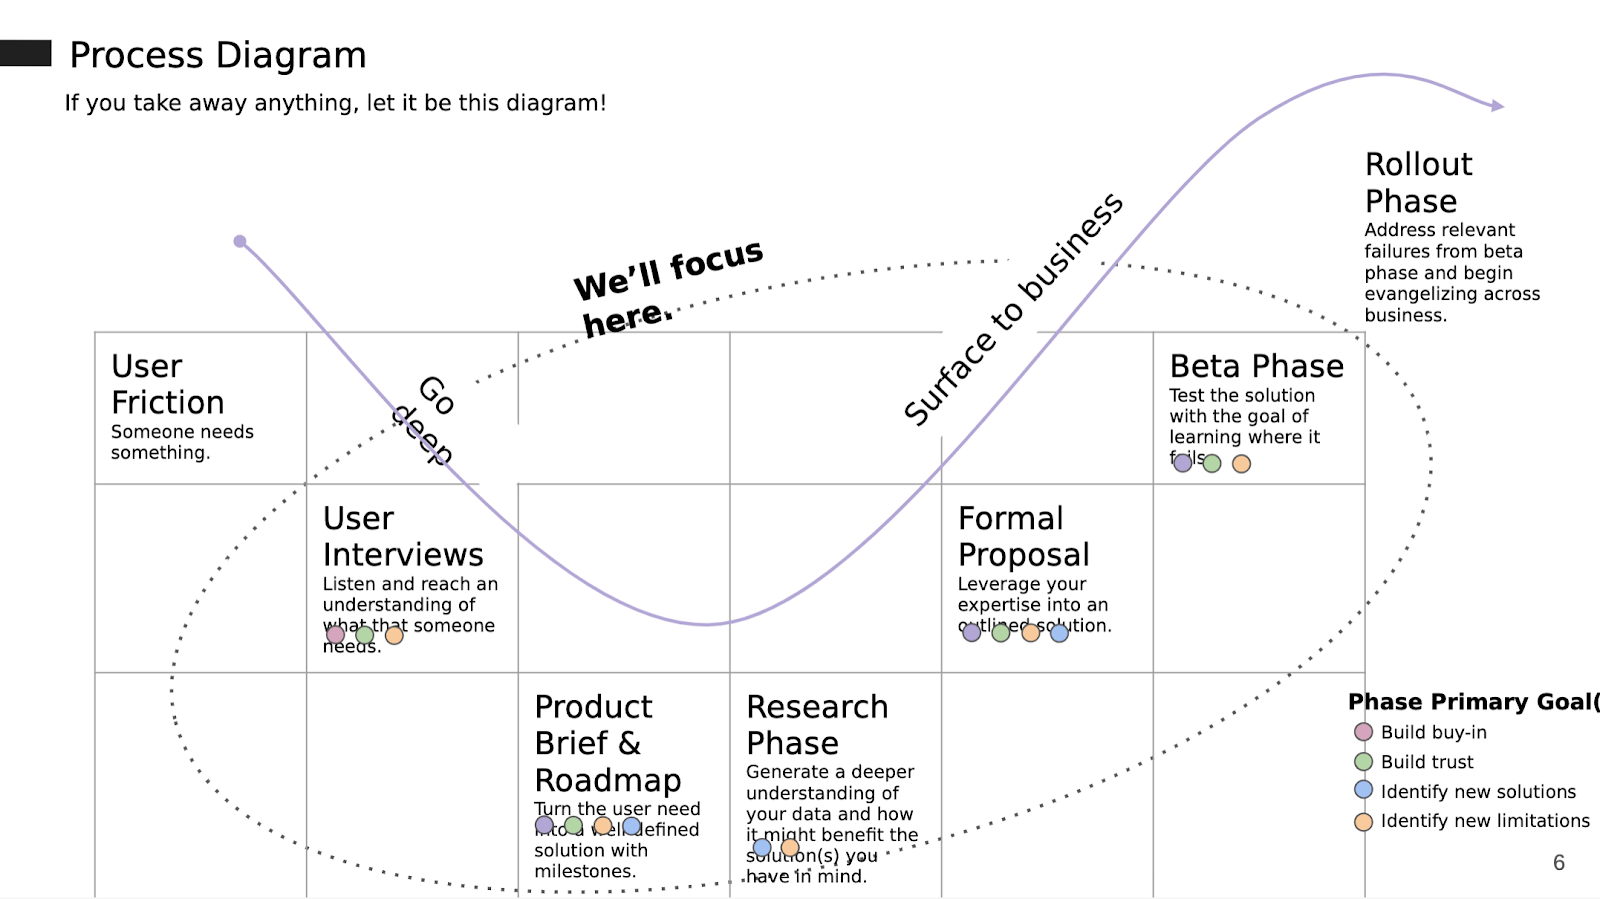
I'm going to focus on what you'll see in the dotted circle, on everything that happens within those phases and some learnings I've had, and tips to take away.
User friction
When you're looking at user friction, just to address it, one of the things I think made this metric a success in my use case was people wanted it. For a long time, we were like, "How do we know if a page was engaged? Does it matter if a page was engaged? Why are we trying to drive this? What is our engaged audience?"
All of these sorts of questions have been asked time and time again, and additionally, there was this friction of wanting to understand how we could develop a metric that would ladder up to these Northstar, super important metrics that people felt like they couldn't move.
This friction of users in this sense, generally product org, enabled us to say, "Hey, let's come in with a solution". And that helps there be buy-in across the organization and making something that folks want to scale.
After that, went into user interviews, that's really just getting a sense of what you want for this metric.
Roadmap
Then making a roadmap for the project with the general brief of what you're going to accomplish and not accomplish, which moves into a research phase, which then you surface everything back out and bring it to the business.
In here, it's really thinking about more of a formal proposal of what this metric actually is and how it's calculated. Maybe at that point, you're like, "Hey, there's two options, not sure which one's gonna work". So then using more of a beta phase, which is an opportunity to control and decide who can use this metric, to better understand its limitations.
Look for failure
The main point I'll make when we get there is really looking to make the metric fail. Because when you find it failing, that means you often understand where it doesn't work, which in some ways is more useful than understanding where it does. That way you can get ahead of the game in what you're advertising this metric within the organization as accomplishing.
Rollout
Lastly, is the rollout phase, I'm not going to go too deeply into that because I think it's hyper-specific to your organization and the metric you're working with.
But that's really thinking about once it's validated and there's alignment, how do you bring it back to the company and start to make it something that's commonly reported?
Now I want to address each of these buckets within that circle individually but before I do, I want to make sure we're on the same page with some of the terms I'm going to be using throughout the article.

Key terms
Core stakeholder
There's this idea of a core stakeholder versus a data stakeholder. Often in this use case, a core stakeholder is going to be someone who is a product manager, if you're thinking about a new metric that's supporting a product organization.
I really would think of these as one or two of the following three things:
- Someone who has a say in the approval process,
- Someone who can help disseminate the work downwards and upwards would be of course a stakeholder because you want their buy-in, and their stewardship
- Someone who's an expert in the domain is going to be super important.
Having at least two of those things I think would warrant someone being a part of that core stakeholder group that you really want to be bought into the success here.
TL;DR
Some folks view this as rude, it means too long, didn't read. I don't view it as rude.
In general, I think it's super important when thinking about your work to make sure folks who are higher level or who are not super bought in have something that entices them and makes them feel like they understand the core concept of what you're trying to do.
North-star metric
Lastly is the north-star metric, the idea here is it's a metric that is a leading indicator of success for your business.
An example might be the start of subscribers, or churn rate or things that are directly below that, that you know are super important in driving subscription or retention for your organization if that's the type of company you work for.
Process diagram phases
Now I'm going to jump into thinking of that process diagram, each of the different phases.
User interviews
When we get into the user interview phase, I want to preface again, there's already been some sort of user friction. I'm sure someone could do an article on how to generate user friction, that's not the goal of this article.
I'm really trying to say, the organization knows the problem you're trying to solve, I'm going to come in and figure out how to pull these stakeholders together to solve it for them to help move the business forward.
Here when looking at user interviews, really the key goal if you're an analyst working on this, or maybe you're even a data-savvy product manager, etc. is making sure you listen really intently to the needs of someone without passing judgment.
The goal is to have as much of a wide swath and breadth of information of what people are feeling, struggling with, desiring, and then your job in the next phase is to fine-tune what that actually means and to pull it into some sort of proposal of research.
I think it's a really good idea to have at least two interviews, I think the more the better, and I think those two interviews should fall into two categories.
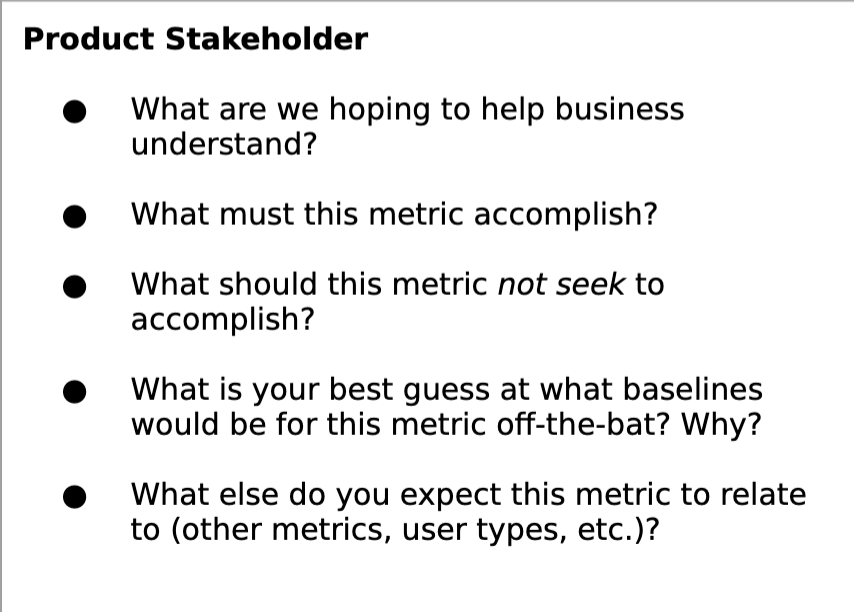
Product stakeholder
One would be someone who's a product stakeholder - this product stakeholder is ideally going to be a part of that core stakeholder group. What you want to really understand from them is essentially:
- What's not working?
- What are you trying to move?
- What do you want to move it?
- What do you expect will move it?
Getting a sense of their hypotheses, given their product expertise, of what should make this thing happen, and what it should describe. That's the general goal there.
I think another crucial thing is making sure you get a sense from them of how they expect this thing will relate to other metrics and to other work that's being done around the organization.
That way, in your research phase, you can do a good job of preemptively relating it back to the broader narrative of how all of your metrics come together to really push those north-star metrics forward.
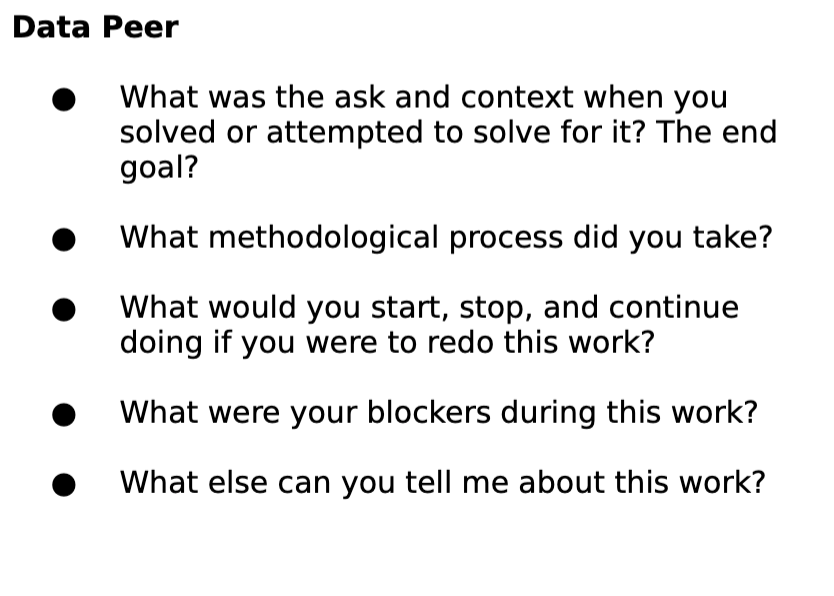
Data peer
On the data peer side is working with someone, and maybe you could end up in a use case where you don't have it, but for me, it was one of my first times working on developing a true blended metric.
I knew there were other folks within the data group at The Times who had done blended metric work before. So I interviewed two folks who had done that, to really get a sense of what they learned from that process.
I knew going into it blended metric means there's a lot of components:
- How do you keep it simple?
- How do you make sure that people understand what this thing is actually describing and what goes into it, and they kind of understand the recipe per se?
So really going into it to understand what they did, how they came over those hurdles that you know you're going to probably run into, and then also anything methods based they did that they found to be useful or indicators they found were successful if they were doing something similar.
I was fortunate I got to meet with folks who had tried to attempt to create a metric like this previously and it didn't quite work out. I was able to get quite a lot from those interviews to help surface it into the work I was doing and to proactively address the blockers they have faced through my research and through my proposals.
To be clear, sometimes addressing doesn't mean solving, it just means noting them. I think a really good example here, and this is getting a little nitty-gritty, but if you think about engagement, depending on how someone is accessing your content, the actual engagement opportunities are very different.
If you've worked with mobile app versus web or desktop data, then you're already aware of how would you even count a page view? Is a page view when you get a text message and you swipe it down and then it goes back up and you look at the page view? Or is it only when you click or tap through to a new piece within an app?
Versus desktop where maybe page view feels like more of a classic 'well you clicked to a new page and you easily generate something, there's no distraction'. Given even that understanding, you can imagine how the downstream impacts of what engaged behaviors might look like if you're thinking time span, or if they're engaging with modules on the page, or things like that, how it would drastically differ based on the app you're working with.
In the past, I think there were some challenges, because that was not proactively addressed in terms of the scope of what the work was seeking to accomplish. So one of the takeaways I had was, "Hey, if the initial version is going to use our easiest data, which is desktop related data, and we're going to solve for that first, we're going to see if it works there and if we can do it there, and we have buy-in, then let's talk about app and mobile".
The idea was to really help hone the scope because I found one of the challenges they had run into in the past was that scope creep, which ended up derailing the work and making it hard to keep everything contained.
Product brief & roadmap
Once you've done your user interviews, you have them documented, ideally in a Google Doc, Word Doc, or whatever you use, then you want to take this work you've done to understand the needs, the learnings, and pull this into a project brief.
Create brief
This project brief should really be something that at its core is going to define what you're seeking to accomplish and what you're not seeking to accomplish, and what you're seeking to describe when it comes to a metric.
I think a great project brief should include the following.
TL;DR
I think the TL;DR is something that's super important, because, in some instances, all you want is for someone to say, "Yeah, that's worth spending time doing".
All they need to know is the key highlights of what's going to exist in the rest of the brief.
What the likely metric won’t solve
What I also think is super important is what the metric won't solve, as I was saying, you did the user interviews - the user interviews mean you have buy-in to do this work.
Not surfacing quotes and learnings directly from those user interviews is only a disservice to your work.
I think it's also a good way to say, "I'm not making the decision to say this is necessarily important or not important", but looping others in so it feels more of a collective and collaborative effort and understanding the scope of the work.
Known data limitations
Also, super important, is known limitations to the data. If there's 'tracking only exists on these certain page types', making sure you call out, "Hey, we're only going to solve for those page types, or we're going to solve for all page types but it might not be the best metric to describe these certain ones, and there should really be a separate line of work that's trying to get tracking better over here", that's an option.
But calling that out from the start, and taking the time to understand what could exist there, in terms of gaps in being able to deploy the metric, I think really helps set yourself up for success in the research phase, because it allows you as an analyst or someone who's supporting an analyst to say, "Hey, we don't need to worry about that rabbit hole", there are rabbit holes abound when thinking about the research work.
It really allows you to just say, "We're good here".
Roadmap
Once you have all of this, it's then worthwhile to put together a proposal of a roadmap given what you're understanding of the work, it's also important to say that this is a living, breathing roadmap.
When I was working on this work, the majority of it was working from home given COVID. As a result, I had a Slack channel where I was posting a Friday update of 'here's the status, things are going as planned' - super short, two bullet points, or 'Hey, this is going to take an extra week because of this discovery or this reprioritization in what I need to accomplish'.
Share with stakeholders
Once you have that brief, it's really important to take a larger stakeholder group, which includes those core stakeholders, but I think also some other folks. Think of analysts, who aren't going to be a decision-maker, but who are going to need to use this.
Or other product teams that might care about it. It's a good opportunity to get people excited and bought in from the get-go, "Hey, this thing is coming down the pipeline, and I'm really excited for this to come down the pipeline".
It's much better to have your efforts keeping things close in terms of when things will become available and what will be available, rather than trying to get people bought in once you have something ready to go.
It's also a really good way from early on to start understanding if there are things you missed during that user interview phase that are worthwhile at least mentioning within the brief. It gives you that opportunity to say, "Hey, I appreciated that feedback but we're not going to address it here".
Making sure also those core stakeholders are involved, all of them, and there's an approval of the work, there's buy-in on the work, and they have a sense of what's happening because they're really the folks you want to have by your side throughout the process.
Research phase
Now I'm going into the deepest part of this work, which is the research phase. This is the part where it's very easy to fall into rabbit holes and to get derailed. It's super crucial here to remain true to the scope of work you outlined in your product brief.
It's also probably the one that will be most unique to the given metric you're trying to develop.
Here the main purpose is not how you should do research, because I'm sure anyone who's working on this will have a good understanding of how to approach it. I think here, it's rather some questions that are worth addressing when you're thinking about a metric specifically.
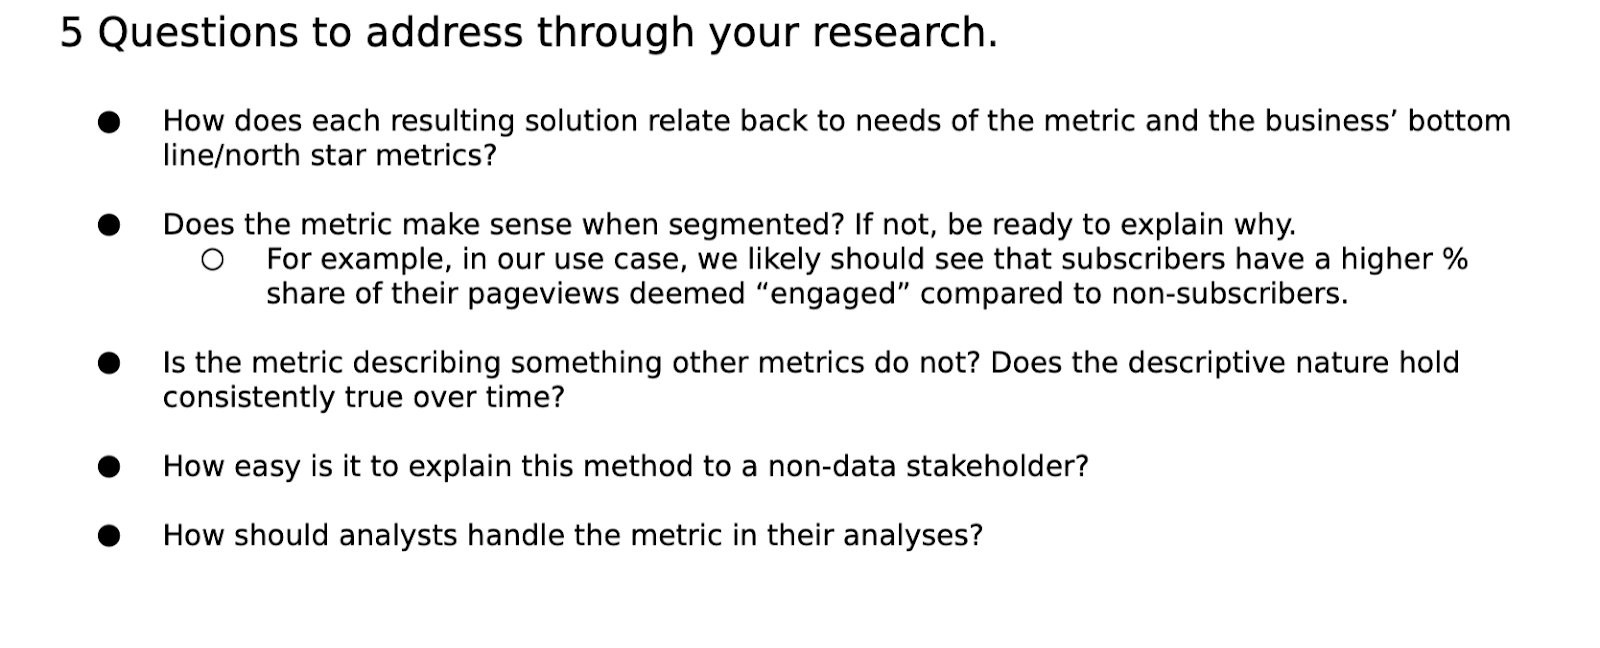
5 questions to address through your research
How does each solution relate back to the needs of the metric and the business’ bottom line/north-star metrics?
One of the most important things probably to most stakeholders is going to be how does this relate to other metrics? And is it descriptive of things we care about?
Again, going back to that north-star idea. Really making sure that during the research phase, once you have an idea of what you think the metric could be or should be, you do that extra analysis and seeing, using retroactive data, what performance would look like, what relationships would exist, and what relationships wouldn't exist, to make that very clearly defined when presenting the options of what you could do or the option if you have one?
Does the metric make sense when segmented? If not, be ready to explain why
Another example is thinking about common business questions that are going to come up. For engaged pageview work that I had, it was a classic assumption to think a subscriber to the New York Times is going to have more engaged pageviews or a stronger percent share of their pageviews that are engaged, than an anonymous user who doesn't even give us their email address.
When you have those assumptions, it's really worthwhile going through and outlining them and being very clear on what you find. A lot of this can also be sourced from that product interview you have during your user interview stage because those product folks are probably going to be the ones who are most curious to know, does this make sense in that fashion?
The rest of the questions are outlined below.
Formal memo
Leverage your expertise into an outlined solution
You now have your research deep dive, and you might want to share that with some of the core stakeholders who are data folks, or if you have a really close product partner you're working with, etc.
To be honest, most stakeholders don't need to see all the research you did so it's important to document it well. Fine-tune that research and have a deep version of all of the work you did, and also, once you're done that deep version, take it and turn it into a succinct version.
Two versions of your formal proposal
Succinct version & deep version
This succinct version is like, "Hey, I'm a product person, I don't need to look at 30 distributions of data and look at box plots, and see all of the descriptive and exploratory analysis you did. I just need to see the questions answered of does this relate to subscription? Does this relate to x, y, and z? And have that put together as well as what the formula for this metric will be?"
I think a good workflow, is writing a deep version, translating that deep version into a succinct version, as I was saying, and then once you have the succinct version, I would share that succinct version only with your core stakeholder group.
Because now at this point, you want their buy-in, so once they're on the same page with you, you get a sense of their expertise.
Something I discovered was there were some events, events meaning interactions that were happening on the page, that maybe were not truly descriptive of someone engaging with an article, but instead engaging with other things like a subscription module or something like that.
Once we were on the same page it was like, "Hey, we should be more considerate of what things we include". So that's a good time to get that feedback from subject matter experts in other areas who have an understanding of their workspace you might not have thought to account for.
Once you get buy-in from the core stakeholders, you make any updates that are necessary, the next step will be sharing it with your broader stakeholder group to launch you into the next part of the process, which is doing more of a beta phase.
Below I have in each column an example of what a deep version versus a succinct version is, I think a really good thing to think about is anything in the succinct version is generally in the deep version - the succinct version is just rolling it up a bit more.
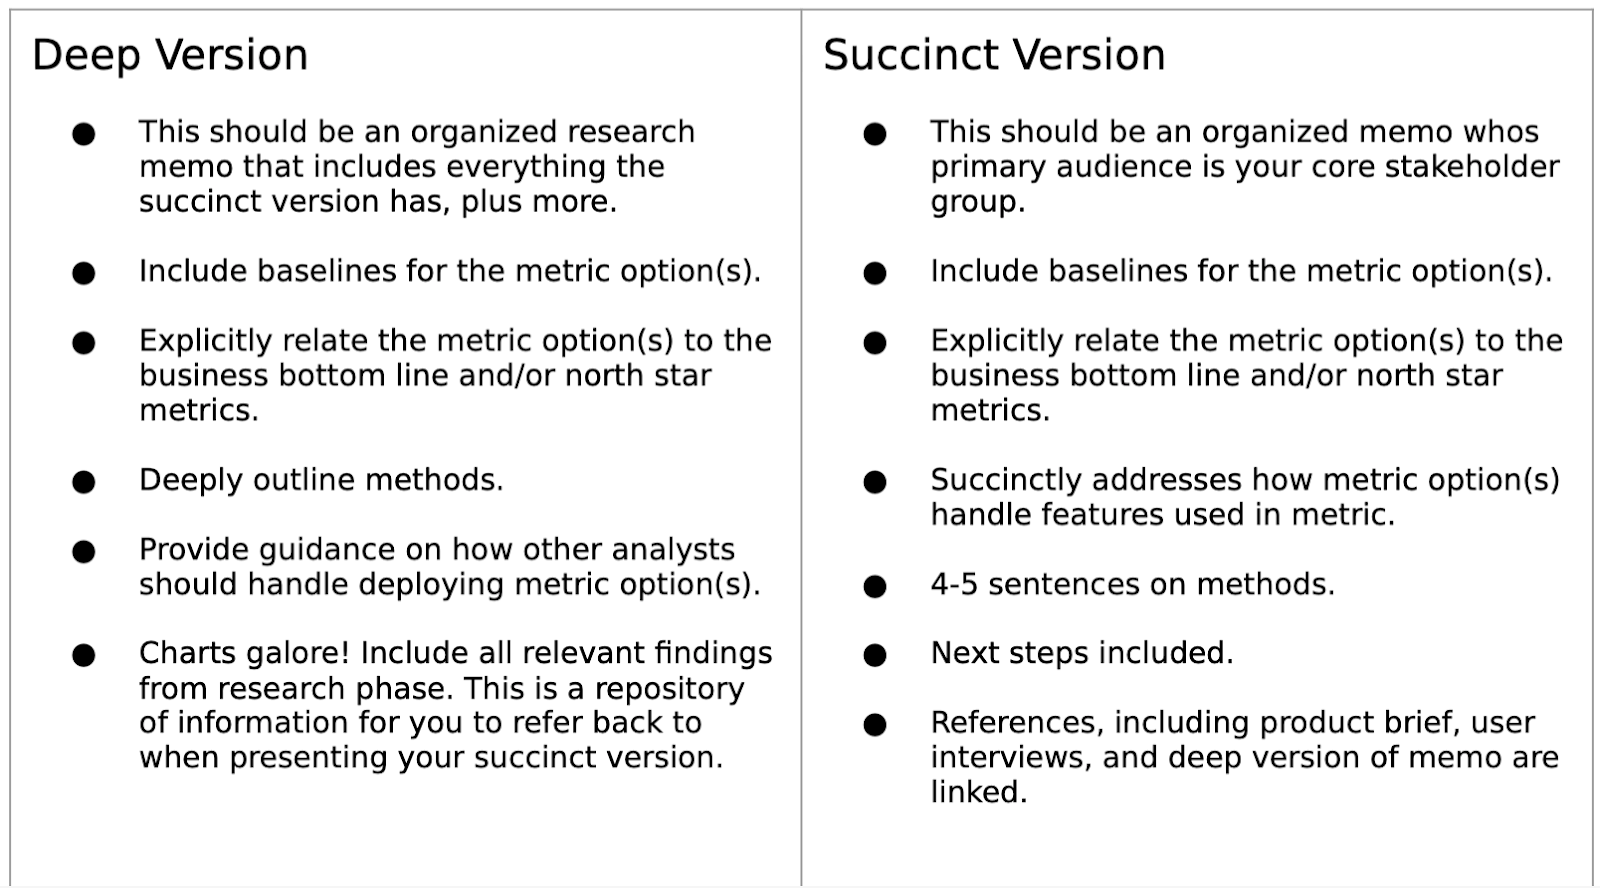
For example, a deep version could have two paragraphs on methods, in the succinct version, don't go over four or five sentences - the simpler, the better. Because people just want to know the core understanding of what's happening, all of the nitty-gritty of assumptions that are being made, etc. you probably can leave in the deep version.
Beta phase
So you share that formal memo out, you start doing a roadshow of it, you meet with hopefully a bunch of different teams.
For me, I did this with our marketing teams, with the subscription team, the advertising team, with the rest of the news products team, also with the new product ventures team, so quite a lot of people.
The idea here was I want to get people excited about this, who are already aware of it, and just see the work I've done.
From there, have folks propose ways they would like to use this out in the wild per se, and then help them do so and make sure the data structure and implementation are such that it's easy for them to do it.
Select at least 2 beta use cases, and up to 3
Here I think it's good to have two to three use cases. Obviously, that's depending on your organization, I think no less than two, but I think probably no more than four or five because, at that point, it's really hard to manage everything that's coming to you.
At least one is a well-defined experiment
One thing I found a major help in success in my beta phase work that I did was I had one of the beta use cases be a test. It was literally seeing, can we move this thing with something that should move it? That was a really easy way to explain we'd reached significance, we knew this was meaningful, descriptive, moveable - it checked all the boxes.
When it came to sharing the beta results back with my core stakeholder group, I found that to be the most effective way of saying, "Hey, I think we should continue investing in this work".
From at least one data team different than your own
Other than that, make sure you're working with a team different than your own, because it's a good way to start getting people comfortable with this, to have other people who are advocating for the use of this metric.
Owned by collaborators eager to use the metric
Make sure you choose beta use cases where the folks leading the implementation are excited. The worst and most challenging thing would be probably getting someone excited about this.
There's no point in just trying to get a team to use it because you want them to use it if they don't want to. That's my advice on this front.
Push the metric to be performant in diverse ways
Again, it's really good to note when you're thinking about pooling the results of this work into a memo - what didn't work? That's going to really help you and your core stakeholder group to decide what you want to do moving forward.
When you're leaving this phase, and this is something throughout the work, keep in mind your goal isn't to be the person who developed the next new shiny thing, it's to truly help the business move forward.
If that means you've learned, "Hey, engaged page views aren't useful, we should just use page views", then that's an important learning and it's just as important as developing the new metric.
So keep agnostic, which was really hard for me to do and I think for anyone who gets in the weeds on this kind of work. It's a long process and what ends up happening at the end of the day, that way can really be best for the business.
Thank you.


Become a PLA Insider
Thank you for subscribing
Get exclusive insights, frameworks, and strategies from product leaders driving real business impact.
An email has been successfully sent to confirm your subscription.
 Follow us on LinkedIn