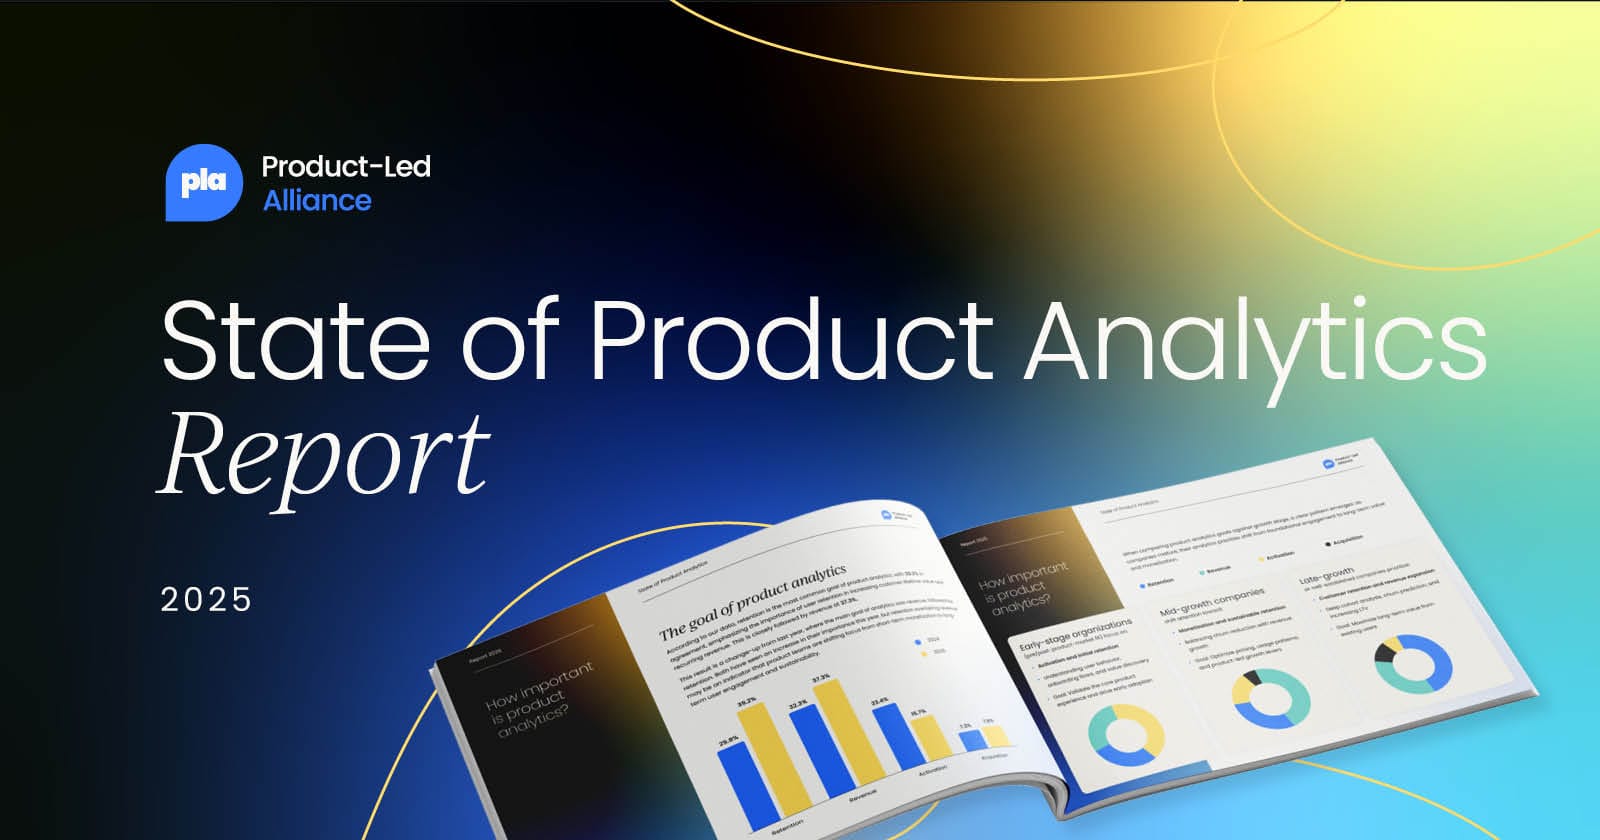
A deep dive into how PMs are using data to drive retention, revenue, and smarter product decisions.
Product analytics has moved from “nice to have” to “non-negotiable.”
But how exactly are product teams using data today? Which metrics matter most? And what separates the leaders from the laggards?
Our latest report reveals how product managers across industries are leveraging analytics to shape roadmaps, increase retention, and build products users can’t live without.
Want to make faster, better-informed product calls? Get your free copy now 👇
What’s inside?
We went straight to the source and spoke to product professionals on the front lines to uncover exactly how analytics is used, where it delivers the most impact, and where teams still struggle.
Here’s a taste:
📊 Exclusive benchmarks on analytics team structures, ownership, and tool adoption
🎯 The #1 goal driving analytics in 2025 (and why it’s changed since last year)
🗣️ How customer feedback fits into the analytics puzzle – and why most teams aren’t using it enough
🛠️ The most-used tools and capabilities in today’s analytics stacks
🚀 Predictions for the analytics capabilities PMs will need to stay competitive in 2026
💡 Expert insights from leaders at Walmart Global Tech, Sedex, and VOC Strategies
Key findings
Just a few of the data points you’ll get inside:
- 72.5% of teams say analytics visibly helped them hit key goals in the past 12–18 months.
- Retention has overtaken revenue as the #1 goal for analytics programs.
- Only 15.7% of teams use customer feedback as a primary data source – despite half relying on it to decide what to build.
- 90.2% of teams segment their product data, most often by persona.
- Just 45.1% have a dedicated product analytics team – though adoption is rising fast.
- 37.3% plan to invest more in analytics software in the near term.
Why PMs should read this
This report is built for product managers who want to make sharper, faster decisions using data that’s grounded in reality – not guesswork.
You’ll see how peers are structuring their analytics, which metrics are proving most useful at each stage of growth, and the specific tools and capabilities delivering the highest ROI.
Use it to:
- Benchmark your analytics approach against industry data
- Identify where your metrics mix might be holding you back
- Spot opportunities to align analytics goals with your company’s growth stage
- Build a stronger case for investment in tools, people, or processes
All without having to sift through endless opinions.


 Follow us on LinkedIn


