Finance for product managers is no longer optional. To build viable products and influence strategy, PMs need to understand how their decisions impact revenue, costs, and profitability.
Yet many product managers focus primarily on adoption, NPS, customer feedback, and analytics – without fully understanding the financial performance behind their work. Knowing how to read financial statements, assess project viability, and connect product outcomes to business results is a critical skill.
This article breaks down the key financial concepts every product manager should understand, so you can confidently evaluate financial performance and make smarter product decisions.
How to understand a company's financial position
Let's break down the key financial statements of a company. There are three main ones you'll need to understand:
- Balance sheet
- Income statement
- Cashflow statement
I have taken an example of the company Meta for this exercise.
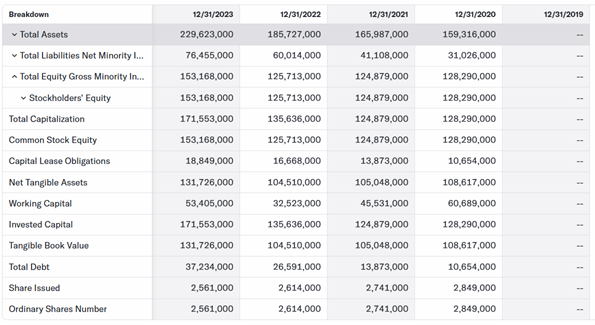
Figure 1: Balance sheet of Meta
How to read a balance sheet
The numbers that are most important in the balance sheet are:
Total assets:
Definition: Total assets represent the sum of everything the company owns and controls that has economic value.
Importance: This number provides a comprehensive view of the company’s resources and is crucial for evaluating the overall size and financial strength of the company.
Total liabilities:
Definition: Total liabilities are the sum of all financial obligations and debts the company owes to external parties.
Importance: This figure is essential for understanding the company’s financial obligations and assessing its leverage and financial risk.
Shareholders' equity
Definition: Shareholders' equity is the residual interest in the assets of the company after deducting liabilities. It represents the owners' claim on the company’s assets.
Importance: This number indicates the net worth of the company from the shareholders' perspective and is a critical measure of financial health. It’s also used to calculate important ratios like Return on Equity (ROE).
These three numbers form the core equation of the balance sheet:
Assets = Liabilities + Shareholders’ equity
Understanding these three figures provides a fundamental insight into the financial position of a company, including its resources, obligations, and the value attributable to its owners.
How to read an income statement
Now let us understand the income statement of Meta.
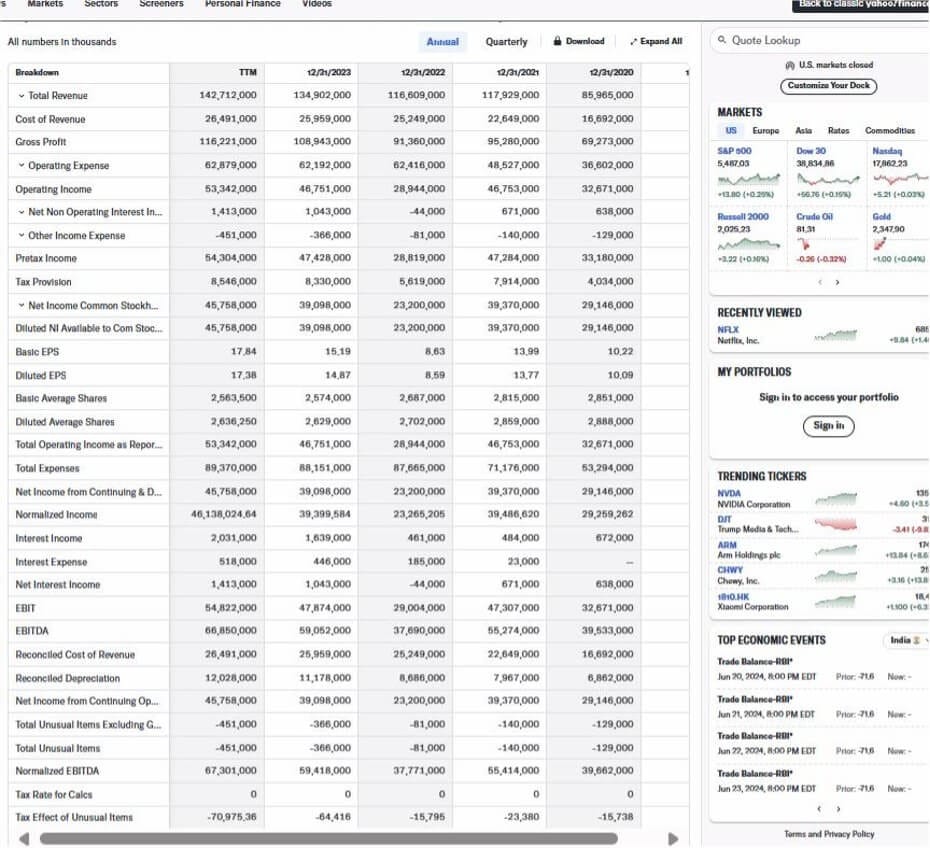
Figure 2: Meta income statement
Revenue (or Sales)
- Definition: The total amount of money generated from the sale of goods or services.
- Importance: This is the top line of the income statement and indicates the company’s ability to generate sales. It provides a clear picture of the company’s market demand and growth potential.
Operating income (or Operating profit or EBIT)
- Definition: Gross profit minus operating expenses (which include selling, general, and administrative expenses).
- Importance: This number shows the profitability of the company’s core business operations before interest and taxes. It is a key indicator of operational efficiency and the company's ability to manage its costs relative to its revenue.
Net income (or Net profit)
- Definition: The total profit of the company after all expenses, including operating expenses, interest, taxes, and any other expenses, have been deducted from total revenue.
- Importance: Net income is the bottom line of the income statement and indicates the overall profitability of the company. It reflects the company’s ability to generate profit for its shareholders and is crucial for assessing the company’s financial health and performance.
These three numbers provide a comprehensive view of a company’s financial performance, from its ability to generate sales, to its efficiency in managing operations, to its overall profitability.
Building a feature-level P&L (incremental view)
Understanding company-wide income statements is valuable, but product managers often need something more granular: a P&L for a single feature. This incremental contribution model helps you evaluate whether a specific feature justifies its investment before you commit engineering resources.
A feature P&L differs from a GAAP income statement in one critical way. You're measuring only the changes caused by the feature, not allocating existing overhead. If your feature doesn't directly increase a cost or generate new revenue, that line stays at zero. This approach keeps your analysis honest and defensible.
As Paolo Lacche, Chief Product Officer & Advisor at Paolo.pm, explains when discussing feature economics: teams should focus on clear objectives like customer acquisition and average revenue per customer (ARPA) because “the more the customers use the product, the more the number goes up.” This usage-driven thinking should inform how you model incremental revenue.
Worked example: Feature P&L in 10 lines
Required inputs for your model:
- Expected adoption rate (what percentage of eligible users will activate)
- Pricing or ARPA impact (does this feature command premium pricing or drive expansion)
- Churn and retention lift (will this reduce cancellations or extend customer lifetime)
- Support cost increase (tickets, documentation, training)
- Infrastructure cost (cloud compute, storage, third-party APIs)
- Implementation effort (professional services, customer success time)
- Marketing and sales impact (launch costs, sales cycle changes)
Uncertainty is unavoidable, so build three scenarios: base case (your realistic estimate), best case (strong adoption, low support burden), and worst case (slow uptake, higher costs). Set thresholds before you run the numbers. Many teams require a minimum annual contribution of $50,000-100,000 or a payback period under 18 months to greenlight a feature.
One important note: talk to Finance about what counts as incremental versus allocated in your organization. Some companies load features with overhead allocation, which can make even strong features look marginal. Understanding your company's conventions prevents surprises during review.
How to read a cash flow statement
Let's look at the Cash Flow Statement of Meta.
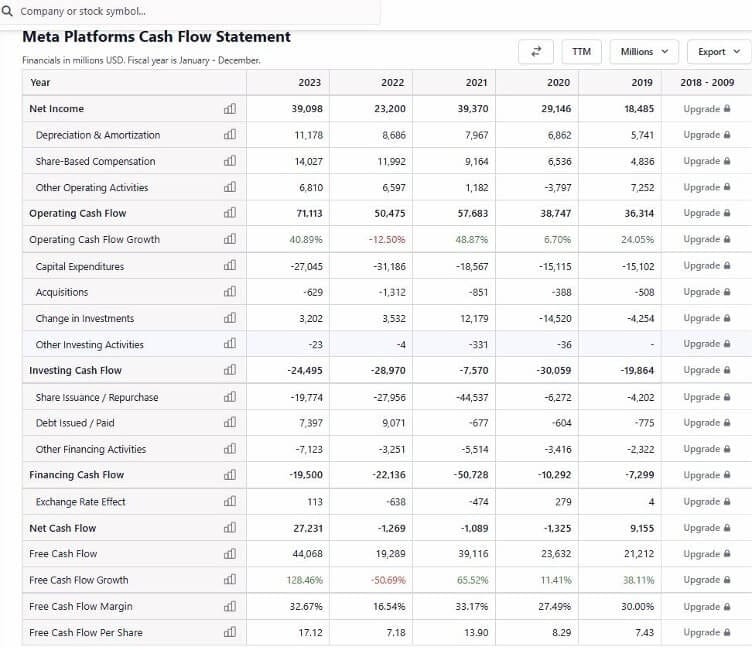
The top three critical numbers in a cash flow statement are:
Net cash provided by operating activities
a. Definition: The total cash generated from the company’s core business operations. This figure adjusts net income for non-cash items like depreciation and changes in working capital (e.g., accounts receivable, accounts payable).
b. Importance: This number indicates the company's ability to generate sufficient cash flow from its regular business activities to sustain operations, pay debts, and invest in growth. It is a key measure of a company's financial health and operational efficiency.
Net cash used in investing activities
a. Definition: The total cash used for investing in the company’s long-term assets, such as purchasing property, plant, and equipment (PP&E), or investments in other businesses. This figure also includes cash inflows from the sale of these assets.
b. Importance: This number shows how much the company is investing in its future growth and development. High levels of investment can indicate expansion and long-term growth prospects, but they also require substantial cash outflows.
Net cash provided by (or used in) financing activities
a. Definition: The total cash received from or used in activities related to financing the company, such as issuing or repurchasing stock, borrowing or repaying debt, and paying dividends.
b. Importance: This number reflects the company’s capital structure decisions and its ability to raise funds to support operations and growth. Positive cash flow from financing activities can indicate successful capital raising, while negative cash flow might indicate debt repayment or dividend distribution.
These three numbers provide a comprehensive view of how a company generates cash, where it is investing for the future, and how it manages its financing. Understanding these figures is crucial for assessing the company’s liquidity, financial flexibility, and overall financial health.
Capital budgeting for product initiatives (NPV vs IRR)
When you're pitching a multi-year product investment to your finance partners, you'll need more than intuition. You'll need capital budgeting metrics that translate your roadmap into language the CFO understands. Two metrics dominate these conversations: Net Present Value (NPV) and Internal Rate of Return (IRR).
Net Present Value (NPV)
Net Present Value calculates the total value of a product initiative by summing all expected future cash flows, discounted back to today's dollars, minus the initial investment.
A positive NPV means the project creates value above your company's cost of capital. The formula is straightforward: NPV equals the sum of each year's cash flow divided by (1 + discount rate) raised to that year's power, minus your upfront investment. For product initiatives, use contribution margin rather than revenue in your cash flow projections.
Let's analyze the following example: a company has to choose between two projects that both cost $10,000 to implement. Each of them will last for 5 years, but they have different expected cash inflows. The discount rate is 5% in each case. Which project should the company choose?
If you use the NPV calculator mentioned in the link above to determine the NPV for each of these projects, you will discover that the NPV of project 1 is equal to $481.55, while the NPV of project 2 is equal to –$29.13.
This result means that project 1 is profitable because it has a positive NPV. Project 2 is not profitable for the company, as it has a negative NPV. That is why the company should choose to implement project 1.
*The discount rate is the interest rate that banks pay the Federal Reserve to borrow money for short-term loans.
Internal Rate of Return (IRR)
Internal Rate of Return is the discount rate at which your project's NPV equals zero. Think of it as the effective annual return your initiative generates.
If your IRR exceeds your company's hurdle rate (typically the weighted average cost of capital plus a risk premium), the project clears the financial bar. IRR is expressed as a percentage, making it easy to compare against other investment opportunities or corporate benchmarks.
To calculate the Internal Rate of Return (IRR) in Excel, you can use the IRR function. Here's how:
- Enter your cash flow data into a column or row.
- Select the cell where you want the result to appear.
- Type “=IRR (range of cash flows), [guess]”.
- Excel will automatically calculate the IRR and display the result as a percentage.
In the IRR formula, “guess” is an optional argument that represents a number guessed by the user that is close to the expected internal rate of return. However, if you use it, Excel can generate better results when not used.
You can’t just decide where to invest considering the IRR values of different projects. You also need to look at the total return the project is generating, the stability of the project, and many more.
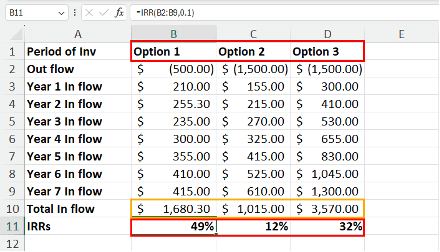
For example, the above dataset compares three investment projects. Here’s a simple analysis of the data:
- Option 1: Fetching a return of $1,680.30 at an IRR of 49%.
- Option 2: Giving a return of $1,015.00 at an IRR of 12%.
- Option 3: Generating a total income of $3,570.00 at an IRR of 32%.
You should definitely avoid Option 2 since it doesn’t generate enough returns for you.
Option 1 does show a whopping 49% IRR but the accumulated return is nominal, $1,680.30 after 7 years of investment.
When to use which (and common traps)
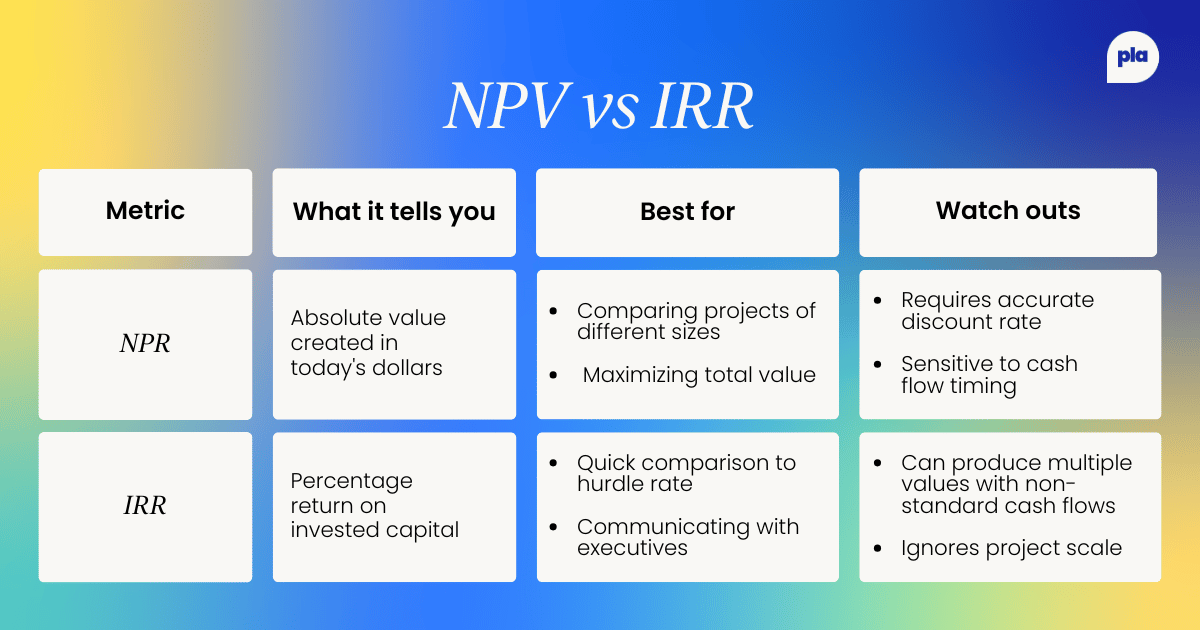
Here's where PMs often stumble. When NPV and IRR disagree (and they will, especially with mutually exclusive projects), NPV should win. A smaller project with a 40% IRR might look attractive, but a larger project with 25% IRR could generate far more absolute value. Always check both.
How to use this in prioritization:
- Estimate year-by-year contribution margin (not revenue) for Years 0 through 3 or 4
- Confirm your company's discount rate with Finance (typically 8-15% for SaaS)
- Calculate NPV using a spreadsheet or financial calculator
- Calculate IRR and compare to your hurdle rate
- If projects are mutually exclusive, rank by NPV, not IRR
- Run sensitivity analysis at discount rates ±2-3% to test robustness
- Document your assumptions clearly for the finance review
Common pitfalls include using revenue instead of contribution margin, ignoring the cost of capital entirely, and assuming linear adoption curves when reality is messier. When your IRR calculation produces multiple values (which happens when cash flows flip between positive and negative), flag it and rely on NPV instead.
Discounted Cash Flows method
Another method involves using Discounted Cashflows, investors can use the concept of the present value of money to determine whether the future cash flows of an investment or project are greater than the value of the initial investment. To conduct a DCF analysis, an investor must make estimates about future cash flows and the ending value of the investment, equipment, or other assets.
The investor must also determine an appropriate discount rate. If the investor cannot estimate future cash flows or the project is very complex, DCF will not have much value and alternative models should be employed.
The formula for DCF is
DCF = CF1/(1+r)1 + CF2/(1+r)2+…CFn/(1+r)n
Where
CF1 = The cash flow for year 1
CF2 = The cash flow for year 2
CFn = The cash flow for additional years
r = Discount Rate
When a company analyzes whether it should invest in a certain project or purchase new equipment, it usually uses its weighted average cost of capital (WACC) as the discount rate to evaluate the DCF. The WACC incorporates the average rate of return that shareholders in the firm are expecting for the given year.
For example, say that your company wants to launch a project. The company's WACC* is 5%. That means that you will use 5% as your discount rate.
*WACC stands for Weighted Average Cost of Capital. It's a key financial metric that represents the average cost of capital a company uses to finance its operations. In simpler terms, it's the minimum return a company expects to pay to its investors (both debt and equity holders) to fund its activities.
The initial investment is $11 million, and the project will last for five years, with the following estimated cash flows per year.
Using the DCF formula, the calculated discounted cash flows for the project are as follows.
Adding up all of the discounted cash flows results in a value of $13,306,727. By subtracting the initial investment of $11 million from that value, we get a net present value (NPV) of $2,306,727.
The positive number of $2,306,727 indicates that the project could generate a return higher than the initial cost—a positive return on the investment. Therefore, the project may be worth making.
If the project had cost $14 million, the NPV would have been -$693,272. That would indicate that the project cost would be more than the projected return. Thus, it might not be worth making.
Cost-benefit analysis for feature prioritization
Capital budgeting metrics like NPV and IRR work well for major initiatives, but most roadmap decisions involve comparing features of varying sizes and certainty levels. A structured cost-benefit framework gives you a repeatable process for these everyday prioritization conversations.
Quantifying benefits (revenue, cost reduction, risk reduction)
Benefits fall into four categories, and you should estimate each separately.
- New revenue comes from features that unlock new customers or market segments.
- Expansion revenue captures upsells and cross-sells to existing accounts.
- Churn reduction translates directly to retained revenue (multiply your average contract value by the percentage point improvement in retention).
- Cost savings include reduced support tickets, lower infrastructure costs, or eliminated manual processes.
As Derya Isler, Vice President of AI Applications at Salesforce, notes on balancing priorities: teams should "approach it as a portfolio and try to allocate sixty, seventy percent of your time on short-term impact" while spending "thirty percent of your time on long-term strategic investments". This portfolio mindset applies directly to how you weigh benefits across your feature candidates.
Quantifying costs (build, run, sell, support)
Costs extend beyond engineering hours. Build costs include design, development, QA, and technical debt. Run costs cover ongoing infrastructure, monitoring, and maintenance. Sell costs account for sales enablement, marketing, and any pricing or packaging changes. Support costs include documentation, training, and anticipated ticket volume.
Decision outputs (ROI, payback, confidence)
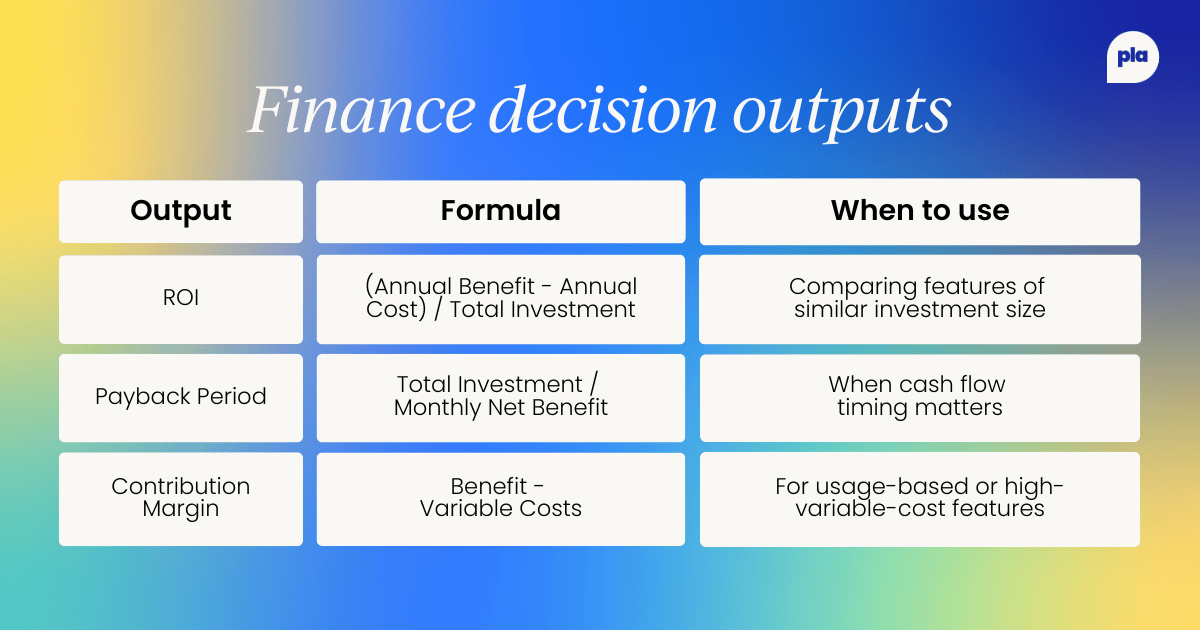
Framework steps:
- List all benefit streams with annual estimates and confidence levels (high/medium/low)
- List all cost streams across build, run, sell, and support
- Calculate ROI and payback period for each feature
- Apply a confidence discount (multiply benefits by 0.8 for medium confidence, 0.5 for low)
- Rank features by confidence-adjusted ROI
- Validate that your top choices align with strategic priorities
- Document assumptions for stakeholder review
- Revisit estimates quarterly as you gather real data
Paolo offers a cautionary perspective on feature evaluation: even when "the feature works" and "the customer problem was valid," a decision can still be poor if "the objectives didn't tick and acquisition and engagement goals were not met." This reinforces why your cost-benefit framework must tie back to explicit business outcomes, not just feature functionality.
What if I can't quantify revenue?
Some benefits resist precise measurement. For retention improvements, use historical cohort data to estimate the revenue impact of a one-point improvement in retention rate.
For engagement features, calculate the correlation between engagement metrics and conversion or expansion in your existing data.
For risk reduction (compliance, security), estimate the cost of the risk event multiplied by its probability. When all else fails, use relative scoring (1-5 scale) and be transparent that you're working with proxies rather than precise figures.
Other financial terms you need to know
EBITDA
Stands for Earnings Before Interest, Taxes, Depreciation, and Amortization, which is an alternate measure of profitability to net income.
EBITDA = Net income + taxes + interest expense + D&A
Or EBITDA = Operating income + D&A
Where D&A = Depreciation and Amortization
The earnings (net income), tax, and interest figures are found on the income statement, while the depreciation and amortization figures are normally found in the notes to operating profit or on the cash flow statement.
EPS (Earnings Per Share)
EPS = total earnings / outstanding shares
Earnings per share (EPS) is the most commonly used metric to describe a company's profitability.
It shows how much profit can be generated per share of stock and is calculated by dividing earnings by outstanding shares.
In simple terms, it's the amount of profit that each stock in the company “owns.” If all the company's profits were distributed to shareholders, this is how much you would get for each share you own.
You can find total earnings, which is the same as net income, and the number of outstanding shares on a company's income statement.
So, for Meta the EPS is 45.6 billion/2.5 billion = 18.01$
Amortization
Amortization is a method of spreading an intangible asset's cost over the course of its useful life. Intangible assets are non-physical assets that are essential to a company, such as a trademark, patent, copyright, or franchise agreement.
Assets
Assets are items you own that can provide future benefits to your business, such as cash, inventory, real estate, office equipment, or accounts receivable, which are payments due to a company by its customers. There are different types of assets, including:
- Current assets: Can be converted to cash within a year
- Fixed assets: Can’t immediately be turned into cash but are tangible items that a company owns and uses to generate long-term income
Asset allocation
Asset allocation refers to how you choose to spread your money across different investment types, also known as asset classes.
Capital gain
A capital gain is an increase in the value of an asset or investment above the price you initially paid for it. If you sell the asset for less than the original purchase price, that would be considered a capital loss
Capital market
This is a market where buyers and sellers engage in the trade of financial assets, including stocks and bonds.
Cash flow
Cash flow refers to the net balance of cash moving in and out of a business at a specific point in time.
Compound interest
This refers to “interest on interest.” Rather, when you’re investing or saving, compound interest is earned on the amount you deposited, plus any interest you’ve accumulated over time.
While it can grow your savings, it can also increase your debt; compound interest is charged on the initial amount you were loaned, as well as the expenses added to your outstanding balance over time.
Depreciation
Depreciation represents the decrease in an asset’s value. It’s a term commonly used in accounting and shows how much of an asset’s value a business has used over a period of time.
Equity
Equity, often called shareholders’ equity or owners’ equity on a balance sheet, represents the amount of money that belongs to the owners of a business after all assets and liabilities have been accounted for.
Using the accounting equation, shareholder’s equity can be found by subtracting total liabilities from total assets.
Liabilities
The opposite of assets, liabilities are what you owe other parties, such as bank debt, wages, and money due to suppliers, also known as accounts payable. There are different types of liabilities, including:
- Current liabilities: Also known as short-term liabilities, these are what’s due in the next year.
- Long-term liabilities: These are financial obligations not due over a year that can be paid off over a longer period of time.
Liquidity
Liquidity describes how quickly your assets can be converted into cash. Because of that, cash is the most liquid asset. The least liquid assets are items like real estate or land because they can take weeks or months to sell.
Net Worth
You can calculate net worth by subtracting what you own, your assets, with what you owe, your liabilities. The remaining number can help you determine the overall state of your financial health.
Profit Margin:
Profit margin is a measure of profitability that’s calculated by dividing the net income by revenue or the net profit by sales. Companies often analyze two types of profit margins:
- Gross Profit Margin: Typically applies to a specific product or line item rather than an entire business
- Net Profit Margin: Typically represents the profitability of an entire company
Return on Investment (ROI)
Return on Investment is a simple calculation used to determine the expected return of a project or activity in comparison to the cost of the investment, typically shown as a percentage.
This measure is often used to evaluate whether a project will be worthwhile for a business to pursue. ROI is calculated using the following equation:
ROI = [(Income - Cost) / Cost] * 100
Valuation
Valuation is the process of determining the current worth of an asset, company, or liability. There are a variety of ways you can value a business, but regularly repeating the process is helpful because you’re then ready if ever faced with an opportunity to merge or sell your company or are trying to seek funding from outside investors
Working Capital
Also known as net working capital, this is the difference between a company’s current assets and current liabilities. Working capital—the money available for daily operations—can help determine an organization’s operational efficiency and short-term financial health.
Final thoughts
Using the above methods, product managers can also add a financial aspect to the projects they want to kick-start. Having financials can help PMs demonstrate to senior management that they have gone above and beyond to determine if a project is profitable for the company to invest in.


Become a PLA Insider
Thank you for subscribing
Get exclusive insights, frameworks, and strategies from product leaders driving real business impact.
An email has been successfully sent to confirm your subscription.
 Follow us on LinkedIn