


Created by:
Not every product in your portfolio deserves the same level of investment. Knowing which ones to back, which to maintain, and which to cut is one of the most important strategic calls you can make.
The growth share matrix gives you a simple, visual way to assess your portfolio against market trends and make those decisions with clarity. Originally developed in the 1970s, it remains one of the most widely used frameworks in product strategy today.
What is a growth share matrix?
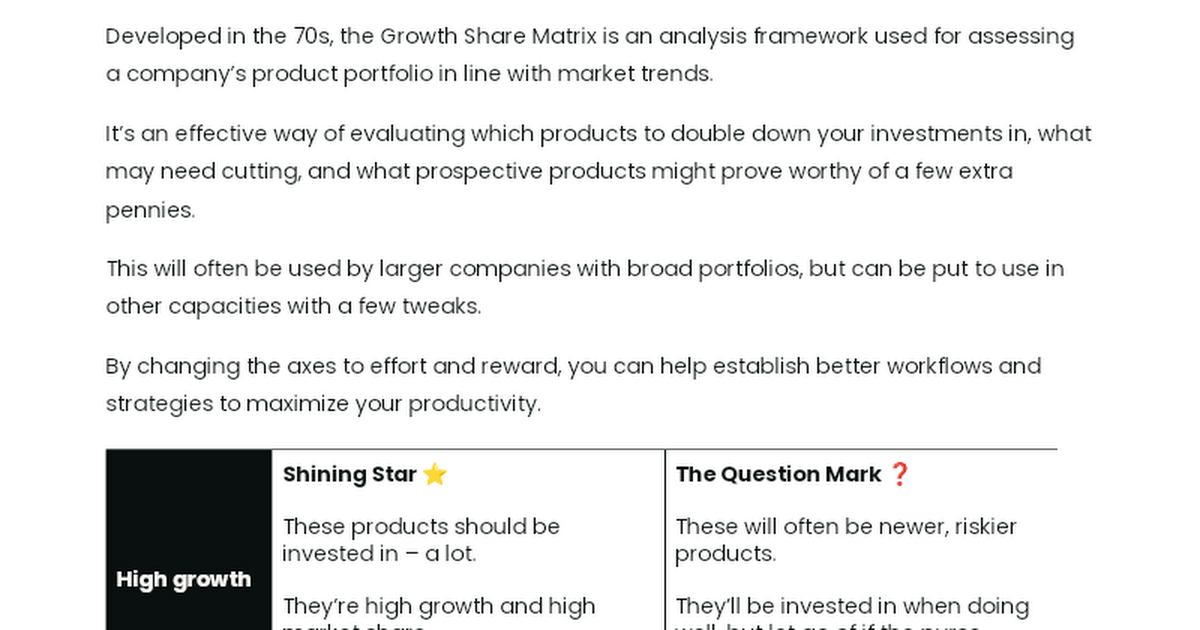
The growth share matrix plots products across two axes – market growth and market share – to sort them into four categories:
⭐ Shining star: High growth, high market share. These are your priority investments — the products with the strongest momentum and the most to gain from continued backing.
❓ Question mark: High growth, low market share. Newer or riskier products that warrant investment when they're performing but are vulnerable when budgets tighten.
🐄 Cash cow: Low growth, high market share. Reliable revenue generators that may not be exciting, but provide the steady returns that fund your stars.
🐱 Pet: Low growth, low market share. Products that need a serious rethink, whether that means reinvigorating, repositioning, or cutting entirely.
The framework can also be adapted beyond portfolio analysis. By swapping the axes to effort and reward, you can use the same structure to evaluate workflows, initiatives, or team priorities.
Who is it for?
This framework is for product managers and product leaders who need a structured way to evaluate and communicate investment decisions across a product portfolio.
While it's traditionally associated with larger organizations managing broad product ranges, it's flexible enough to be useful at any scale and adaptable to a range of strategic planning contexts.
How to use the framework
Map each product in your portfolio to one of the four quadrants based on its current market growth rate and relative market share. Use the resulting picture to guide investment conversations – doubling down on stars, protecting your cash cows, making considered bets on question marks, and being honest about which pets are worth saving.
Revisit the matrix regularly as market conditions shift, and consider adapting the axes if you want to apply the same thinking to initiatives, features, or internal workflows.
Get your growth share matrix template


Become a PLA Insider
Thank you for subscribing
Get exclusive insights, frameworks, and strategies from product leaders driving real business impact.
An email has been successfully sent to confirm your subscription.
 Follow us on LinkedIn