


Web applications have become an integral part of our daily lives. From online shopping to social media platforms, these applications are constantly evolving to meet the increasing demands of users.
But with the growing complexity and size of web applications, optimizing their performance has become crucial for ensuring a seamless user experience and staying ahead in the competitive market.
Common performance bottlenecks that can affect the user experience include slow loading times, high server response times, inefficient database queries, and excessive network requests.

Real-world numbers back this up. …proving that performance hiccups quickly translate into abandoned sessions and lost revenue.
What is a performance bottleneck?
A performance bottleneck is any point in your system where a single component can't keep pace with demand — and slows everything else down as a result.
Think of it like a highway merging into one lane. It doesn't matter how fast the cars are moving before or after that point; traffic still backs up at the pinch. Your web app works the same way: one slow component creates a ripple effect that users feel, even if the rest of your system is running perfectly.
Bottlenecks can live anywhere — in your database, your server, your front-end code, or your network. And they don't always look the same. One app might be choked by a poorly indexed database query, another by render-blocking JavaScript that stops the page from loading.
The tricky part? A bottleneck often isn't obvious until traffic picks up. What seems fine at 100 users can completely fall apart at 10,000. That's why identifying and addressing them proactively — rather than waiting for users to complain — is one of the most important things you can do for your app's health.
In short, a bottleneck is wherever your system hits its ceiling. Find it, fix it, and your entire app gets faster.
Benefits of identifying performance bottlenecks early
Finding bottlenecks before your users do isn't just good practice — it's good business. Here's why it's worth investing the time.
Michael Giannangeli, Head of Product, Software Experiences, Alexa Devices, Amazon Lab126, cited these stats at a conference: “Google found that an extra half a second led to traffic falling by 20%. Amazon found that every 100 milliseconds of page load time reduced sales by 1%.”
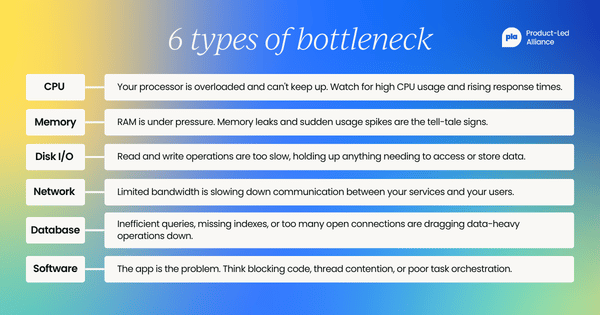
Types of performance bottlenecks
Before you can fix a bottleneck, you need to know what kind you're dealing with. Most performance issues fall into one of these six categories:
- CPU bottleneck: The processor is overloaded and can't keep up with demand. You'll often see high CPU usage, slow processing, and rising response times.
- Memory bottleneck: RAM is under pressure or being used inefficiently. Memory leaks, excessive object creation, and sudden usage spikes are common warning signs.
- Disk I/O bottleneck: Read and write operations are too slow, which delays data access and storage-heavy tasks.
- Network bottleneck: High latency or limited bandwidth slows communication between services, APIs, and users.
- Database bottleneck: Inefficient queries, missing indexes, or too many open connections drag down data-heavy operations.
- Software limitations: The limitation comes from the application itself, such as blocking code, thread contention, or poor task orchestration.
Each bottleneck type has different symptoms, which is why diagnosis and resolution need to be specific to the problem at hand.

Common causes of performance bottlenecks
Most bottlenecks are predictable. And once you know what causes them, you'll start spotting the warning signs a lot earlier. Here are the usual suspects:
- Poorly written code. Inefficient loops, redundant function calls, and bloated logic all add up. Your app might technically work, but it's working way harder than it needs to. Regular code reviews and profiling sessions catch this early.
- Blocking operations. When one operation has to be fully completed before the next one can start, everything stacks up behind it. This is especially painful in I/O-heavy apps where a network call or disk read holds the whole show up. Async programming patterns exist for exactly this reason.
- Thread contention. In multi-threaded environments, multiple threads competing for the same resource end up waiting on each other, which completely defeats the point of running things concurrently.
- Inefficient database queries. One slow query against an unindexed table can drag your whole app down as traffic grows. Missing indexes, over-fetching data, and poorly structured queries are all common offenders — and usually among the easiest fixes once you've spotted them.
- Too many network requests. Every external HTTP request adds latency, and it stacks up fast. Minimizing requests, batching where you can, and caching frequently accessed assets all make a real difference.
- Memory leaks. When your app holds onto memory it no longer needs, it quietly eats up available RAM until performance tanks — or the whole thing crashes. They're hard to spot in real time, which is exactly why continuous monitoring matters.
- Misconfiguration. Sometimes the bottleneck has nothing to do with your code. Under-provisioned servers, poorly tuned caching settings, and suboptimal database connection limits can all throttle performance before a single user hits your app.
- Thread pool exhaustion. If your app relies on a thread pool to handle concurrent requests, hitting the limit means new requests queue up and wait. Under heavy load, that backlog compounds quickly.
- Outdated or legacy components. Old libraries and legacy infrastructure weren't built for modern traffic demands. Running them in production often means missing out on performance improvements that newer versions have already solved.

How to identify performance bottlenecks: step-by-step
Spotting a bottleneck isn't always straightforward — especially when everything seems fine until traffic spikes. The good news? There's a reliable process for tracking them down. Here's how to do it systematically.
Step 1: Set a performance baseline
Before you can identify what's wrong, you need to know what "normal" looks like. Establish baseline metrics for your app's CPU usage, memory consumption, response times, and database query speeds under typical load. Without a baseline, you're just guessing.
Step 2: Monitor your key performance metrics
Keep a close eye on the indicators that signal trouble. The most telling ones are:
- CPU and memory usage
- Server response times
- Database query performance
- Network latency
- Page load times
Monitoring tools and server logs are your best friends here. Regularly reviewing these metrics helps you catch issues before users start complaining.
Step 3: Conduct load and stress tests
This is where you deliberately push your system to its limits. Load testing simulates high-traffic scenarios — like thousands of concurrent users — to reveal how your app behaves under pressure. Stress testing takes it further, identifying the exact point where things start to break down.
The goal is to surface bottlenecks in a controlled environment rather than discovering them during a product launch.
Step 4: Profile your code
Once you've got a sense of where things are slowing down, profiling tools let you zoom in on why. They give you detailed data on execution times and resource usage across different parts of your app, so you can pinpoint the exact components causing drag — whether that's a bloated function, a blocking operation, or an inefficient algorithm.
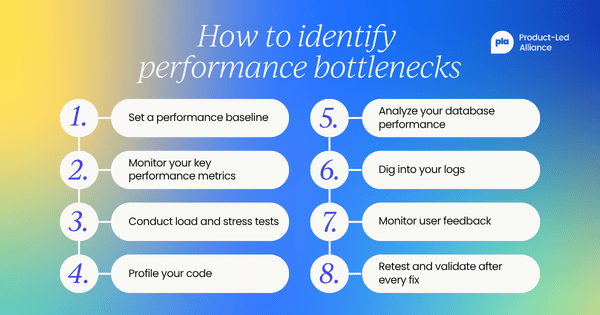
Step 5: Analyze your database performance
Databases are one of the most common culprits. Look for slow or inefficient queries, missing indexes, and excessive open connections. Profiling tools can flag these quickly, and reviewing your indexing strategy often reveals quick wins you didn't know were there.
Step 6: Dig into your logs
Server logs are a goldmine of diagnostic information that often gets overlooked. Analyzing them can surface patterns — like specific requests that consistently time out, or errors that spike at particular times of day — that point you toward the source of a bottleneck.
Step 7: Monitor user feedback
Sometimes the most useful signal comes straight from your users. Complaints about slow load times, laggy interactions, or timeouts can help you prioritize which bottlenecks to tackle first. Pairing user feedback with your technical metrics gives you the full picture.
Step 8: Retest and validate after every fix
Fixing a bottleneck doesn't mean you're done — it means you need to rerun your tests to confirm the improvement and check that no new issues have been introduced. Performance optimization is an ongoing process, not a one-time task.

How to fix performance bottlenecks
Once you've identified where the problem lives, the fix depends entirely on the type of bottleneck you're dealing with. Here's how to tackle the most common ones.
Database bottlenecks
Slow databases are one of the most common performance culprits — and usually one of the most fixable. Start by using profiling tools to surface slow or inefficient queries, then check whether your indexes are actually being used (missing or underutilized indexes are a very common offender).
Beyond queries, keep an eye on how many database connections are open at any one time. Too many concurrent connections drain resources fast. Connection pooling helps here — and pairing it with smart caching strategies (like query result caching or content caching) means you're not hitting the database repeatedly for the same data.
Network bottlenecks
Network issues often sneak up on you. Bandwidth limitations and high latency can quietly drag down performance long before users start noticing something's wrong.
The biggest wins usually come from reducing the number of external HTTP requests your app makes, and optimizing the assets being transferred — compressing JavaScript, CSS, and images goes a long way. Content delivery networks (CDNs) are worth serious consideration too: by serving content from servers closer to your users, they cut latency and reduce the load on your origin server at the same time.
Server-side bottlenecks
If your server-side code isn't optimized, no amount of front-end polish will save you. Inefficient algorithms and unoptimized logic create slow response times that compound under load — so regular code reviews matter more than people give them credit for.
Scalability is the other big one. If your server doesn't have the resources to handle concurrent requests, things fall apart fast when traffic spikes. Load balancing distributes incoming traffic across multiple servers to prevent any single one from becoming overwhelmed, while clustering groups servers together to act as one system — giving you both better performance and fault tolerance.
Front-end bottlenecks
Front-end performance is often where users feel the pain most directly. The good news is there are a lot of levers to pull. Minifying and compressing your HTML, CSS, and JavaScript reduces file sizes; optimizing and resizing images helps too. Lazy loading — where only the content a user actually needs right now is loaded initially — can make a huge difference to perceived load times.
Render-blocking resources are another common culprit. Loading JavaScript and CSS asynchronously lets the browser keep rendering the page instead of waiting. Combine that with browser caching for static assets and GZIP compression, and you've got a solid foundation for a fast front-end.

Key takeaways
- Regularly monitoring server response times and database performance is crucial for identifying potential performance issues before they impact users.
- Analyzing overall system resource utilization can help uncover any bottlenecks or inefficiencies that may be slowing down the website's performance.
- Implementing caching mechanisms can significantly improve page load times by storing frequently accessed data and reducing the need for repeated requests to the server.
- Utilizing content delivery networks (CDNs) ensures that website content is delivered quickly to users across different geographical locations, minimizing latency and improving the overall user experience.
- Proactively addressing performance issues through optimization strategies helps maintain a high-performing website over time, enhancing user satisfaction and potentially increasing conversion rates.
Tip for readers: Implementing the discussed strategies to address bottlenecks is essential for businesses to enhance user experience and maximize their online presence.
By proactively optimizing website performance, businesses can mitigate the negative impact of slow load times, high bounce rates, and low user engagement. This proactive approach will not only attract and retain users but also improve search engine rankings, ultimately leading to increased traffic and conversions.
Frequently asked questions
What is a performance bottleneck?
A performance bottleneck is a specific part of your system that limits overall speed or capacity. When that component can't keep up, it slows everything connected to it and hurts response times and user experience.
What is an example of a performance bottleneck?
A common example is a slow database query running against an unindexed table. As traffic increases, that one query can delay every request that depends on it.
How do you find performance bottlenecks?
Start by looking at your system metrics together: CPU utilization, memory usage, response times, disk activity, network latency, and database query performance. Then use profiling and load testing to confirm which component is creating the slowdown.


Become a PLA Insider
Thank you for subscribing
Get exclusive insights, frameworks, and strategies from product leaders driving real business impact.
An email has been successfully sent to confirm your subscription.
 Follow us on LinkedIn