


Product management in 2026 is operating under more pressure than ever. Tighter budgets, higher expectations, and a flood of AI tools that promise to change everything — but how much is actually changing on the ground?
We pulled every stat from our State of Product Management 2026 report in partnership with ProductPlan — a survey of nearly 250 product professionals across industries and company sizes — and organized them into one place. Use it to benchmark your team, find data for a presentation, or just see how your challenges stack up against everyone else's.
Product strategy statistics
How aligned are teams — really? These product strategy statistics reveal the gap between where teams think they are and where they actually need to be.
What's causing strategy–roadmap misalignment?
When alignment breaks down, it's rarely because the strategy itself is weak. The data points to execution pressure as the main culprit.
- 49.2%cite resource and capacity constraints as the top cause of misalignment
- 47.5%cite shifting priorities due to short-term commitments
- 43.9%cite frequent leadership direction changes
- 35.2%cite sales-driven feature requests
- 28.3%cite customer escalations
- 27%cite lack of discovery or customer insight
- 26.6%cite pressure to deliver outputs (features) over outcomes
- 26.2%cite strategy not being clearly translated into roadmap criteria
- 25%cite technical constraints
What factors influence product strategy most?
- 57.8%Leadership direction and internal priorities — the #1 influence on product strategy
- 54.9%Customer needs and user insights
- 32%AI and technology innovation
- 30.7%Sales or customer escalation requests
- 30.7%Market and competitive shifts
- 20.5%Resource or capacity limitations
- 18.4%Technical or operational constraints
- 14.8%Outcome metrics, OKRs, or long-term vision
The biggest influences on product strategy are immediate pressures (leadership direction, customer needs), while longer-term anchors like outcome metrics and vision rank much lower. Short-term urgency consistently overrides strategic intent.
How much time do PMs spend on strategy?
How well is strategy communicated across teams?
The communication gap: Product teams are sharing strategy, but it isn't consistently translating into shared understanding. A 3/5 across both metrics means there's a meaningful gap between what product thinks is landing and what other teams are actually absorbing.
How does maturity affect strategy alignment?
- 4/5Fully product-led organizations average on both strategy and roadmap alignment — the highest of any group
- 3.2/5Outcome alignment score for project-based organizations
- 3.1/5Outcome alignment for organizations transitioning to product-led — lower than project-based, showing a dip during transition
- 3.4/5Roadmap alignment score for project-based organizations
- 3.2/5Roadmap alignment during transition — alignment drops before it improves
Product prioritization statistics
Prioritization is where strategy meets reality. These product prioritization statistics show how teams are (and aren't) making decisions.
Who has the final say?
- 31.2%Product leadership has final approval — the most common arrangement
- 19.3%CEOs have final say on prioritization
- 16.4%Individual Product Managers have final approval
- 7.4%CTOs hold final approval
- 7.4%have no clear decision-maker — a signal of prioritization processes that remain informal
- 6.1%use a shared decision among PM, engineering, and design
How structured is the prioritization process?
What criteria do teams use to prioritize?
- 58.2%prioritize based on customer impact or value
- 48.8%prioritize based on business impact or ROI
- 38.9%prioritize based on strategic importance or differentiation
- 33.6%factor in effort, complexity, or technical feasibility
- 26.6%prioritize based on alignment to business OKRs
- 20.9%use insights from research, data, or discovery
- 20.1%rely on intuition or expert judgment
- 13.5%consistently use a formal scoring or prioritization framework
- 4.1%use AI-generated or AI-assisted scoring and analysis
How often do priorities change?
What overrides prioritization frameworks?
- 60.2%Leadership escalations or new directives — the most common override
- 38.5%Sales or customer escalations
- 38.1%Revenue or commercial pressure
- 36.1%High-value new opportunities
- 34%Resource or capacity limits
- 29.9%Technical constraints
- 15.2%Market or competitive shifts
- 12.3%AI or technology innovation
How much time goes to prioritization?
Product success metrics statistics
How are teams measuring what actually matters? These stats show how product orgs define and track success — and where measurement confidence is lacking.
Top metrics used to measure product success
- 38.1%Customer satisfaction (CSAT/NPS)
- 34.4%Active usage
- 29.1%Revenue influenced by product improvements
- 28.7%Workflow or feature adoption
- 26.2%Retention/churn
- 23.8%Expansion revenue
- 21.7%Reduction in customer pain points
- 20.1%Outcome attainment (customer achieved intended result)
- 19.3%Time-to-value
- 13.9%Customer task success/completion
- 10.2%Cycle time or delivery efficiency
- 5.7%AI-driven efficiency gains
Customer insight statistics for product teams
Getting close to the customer is one thing. Turning that insight into decisions is another. Here's where teams are succeeding — and where they're falling short.
How teams approach customer feedback
- 34%Regularly collect insights and use them to guide prioritization
- 19.3%Rely mostly on ad-hoc customer requests or escalations
- 18.9%Collect insights but struggle to turn them into decisions
- 12.3%Don't have a consistent research or feedback process
- 10.2%Rarely conduct research and rely on internal perspectives
- 5.3%use AI tools to synthesize or interpret customer feedback
How teams use AI for customer insights
- 47.1%use AI to summarize customer feedback
- 40.2%use AI to draft research summaries or briefs
- 40.2%use AI to turn raw feedback into structured insights
- 39.8%use AI to identify themes or patterns
- 14.3%use AI to prioritize customer problems
- 27.9%do not use AI for customer insights or discovery work at all
The pattern is clear: AI is being used primarily as a synthesis tool — helping teams make sense of feedback faster. Far fewer teams are using it to directly support prioritization or problem selection. AI supports sense-making; decision-making remains human.
AI in product management statistics
AI is reshaping how product teams work — but adoption is still uneven and the biggest gains are still emerging. Here's where things stand right now.
Where are teams in their AI adoption journey?
What are teams' biggest AI hesitations?
- 53.3%Data privacy or security — the #1 concern
- 46.7%Inaccuracy or hallucination risk
- 33.2%Governance or compliance concerns
- 28.3%Lack of training or skills
- 21.3%Cost concerns
- 20.9%Low trust in AI output
- 20.1%Lack of clear guidance from leadership
- 11.9%Fear of role changes or job impact
- 9%feel AI adds more work than it saves
- 14.8%report no major concerns about AI
What value are teams actually realizing from AI?
- 59.8%Time saved on repetitive tasks — the most commonly reported value from AI
- 50.4%Faster insight synthesis (customer feedback, research)
- 32.4%More consistent documentation
- 32%More strategic time for PMs
- 29.5%Better quality in discovery or analysis
- 27%Improved cross-team communication
- 18.9%Faster delivery cycles
- 13.5%No meaningful value yet
- 12%Improved roadmap clarity or accuracy
- 11.5%More confident prioritization decisions
What's blocking teams from getting more value out of AI?
- 47.1%Limited integration into existing tools/workflows — the biggest barrier
- 42.6%Lack of AI training or enablement
- 36.1%say it's still early — they're experimenting
- 29.1%Governance or compliance constraints
- 24.2%Unclear or poorly defined use cases
- 23.8%Lack of leadership clarity or direction
- 22.5%Poor data quality or access
- 19.7%Tools not designed for product workflows
- 16.8%Conflicting expectations across teams
Product manager role evolution statistics
The PM role is changing — fast. These statistics show what product professionals and leaders expect the role to look like in the near future.
How do PMs expect the role to evolve?
- 45.5%expect deeper technical understanding (data fluency, system architecture, AI/ML literacy)
- 45.1%expect more generalist "full-stack PM" roles handling product, discovery, and delivery
- 43.4%expect more hybrid PM roles blending product, design, and engineering
- 37.7%expect more specialization by product area (platform, integrations, AI features)
- 34.4%expect more specialization by industry (FinTech PM, HealthTech PM)
- 21.3%expect more specialization by persona (admin PM, enterprise PM)
What excites and concerns PMs about hybrid roles?
How is AI impacting hiring and team structure?
- 39.8%say it's still too early to tell how AI is affecting team structure
- 25.4%report no change to hiring or team structure due to AI
- 25%are hiring PMs with AI expertise
- 18.4%are shifting responsibilities across roles
- 18%are consolidating roles instead of adding headcount
- 10.7%are hiring more technical PMs
- 10.2%are hiring fewer designers or researchers
- 8.6%are hiring fewer PMs overall
Specialization stat: 44.7% view increased specialization as mostly helpful, while 37.3% expect a mix of benefits and trade-offs. Fewer than 5% see specialization as clearly negative.
Product tool stack and workflow statistics
Where are roadmaps actually living? How integrated are product workflows? And what investments are teams planning for next year? Here's the data.
Where do roadmaps live?
- 27.9%use a dedicated roadmapping tool
- 27.9%use a general work management or dev tool
- 15.6%still rely on spreadsheets
- 12.3%use presentation tools
- 7.8%use wiki or document tools
- 5.7%use whiteboarding tools
- 2.8%don't maintain a centralized roadmap at all
How connected are product workflows?
Are teams consolidating tools?
Why are teams consolidating tools?
- 50.4%Reduce cost — the #1 driver of tool consolidation
- 40.2%Improve workflow efficiency
- 38.9%Reduce complexity or tool sprawl
- 30.7%Improve visibility and shared alignment across teams
- 25%Improve data consistency across systems
- 15.2%Leadership directive to simplify the stack
- 12.3%AI capabilities differ across tools
What are teams investing in for 2026?
- 39.3%Customer research and insight synthesis — the top investment priority
- 36.5%Strategy definition and alignment
- 32.4%Outcome and impact measurement
- 32%Prioritization and decision frameworks
- 27.9%Delivery coordination and execution
- 25%AI-assisted product workflows (research, prioritization, roadmapping)
- 23.8%Roadmapping and planning
- 21.3%Feedback management and discovery workflows
- 16.4%Launch planning and adoption enablement
- 9.8%Integrations and DevOps alignment
Biggest product management challenges for 2026
What keeps product leaders up at night? Here's what the data says about the biggest challenges expected in the year ahead.
- 32.8%Market or competitive pressure — the top anticipated challenge
- 24.2%Economic uncertainty
- 21.7%Becoming more outcome-focused
- 19.7%Limited bandwidth or capacity
- 17.2%Managing technical debt
- 16.4%Aligning teams around strategy
- 15.6%Customer retention or churn
- 15.6%Hiring or resourcing constraints
- 11.1%Adopting AI responsibly and effectively
- 7.4%Tooling limitations or inefficiencies
- 6.6%Training teams or building AI skills
Maturity shifts what challenges look like: In fully product-led organizations, market and competitive pressure jumps to 45.1% — far outweighing internal concerns. In transitioning organizations, economic uncertainty (29.4%) and becoming more outcome-focused (27.9%) dominate. As maturity increases, challenges move from internal to external.
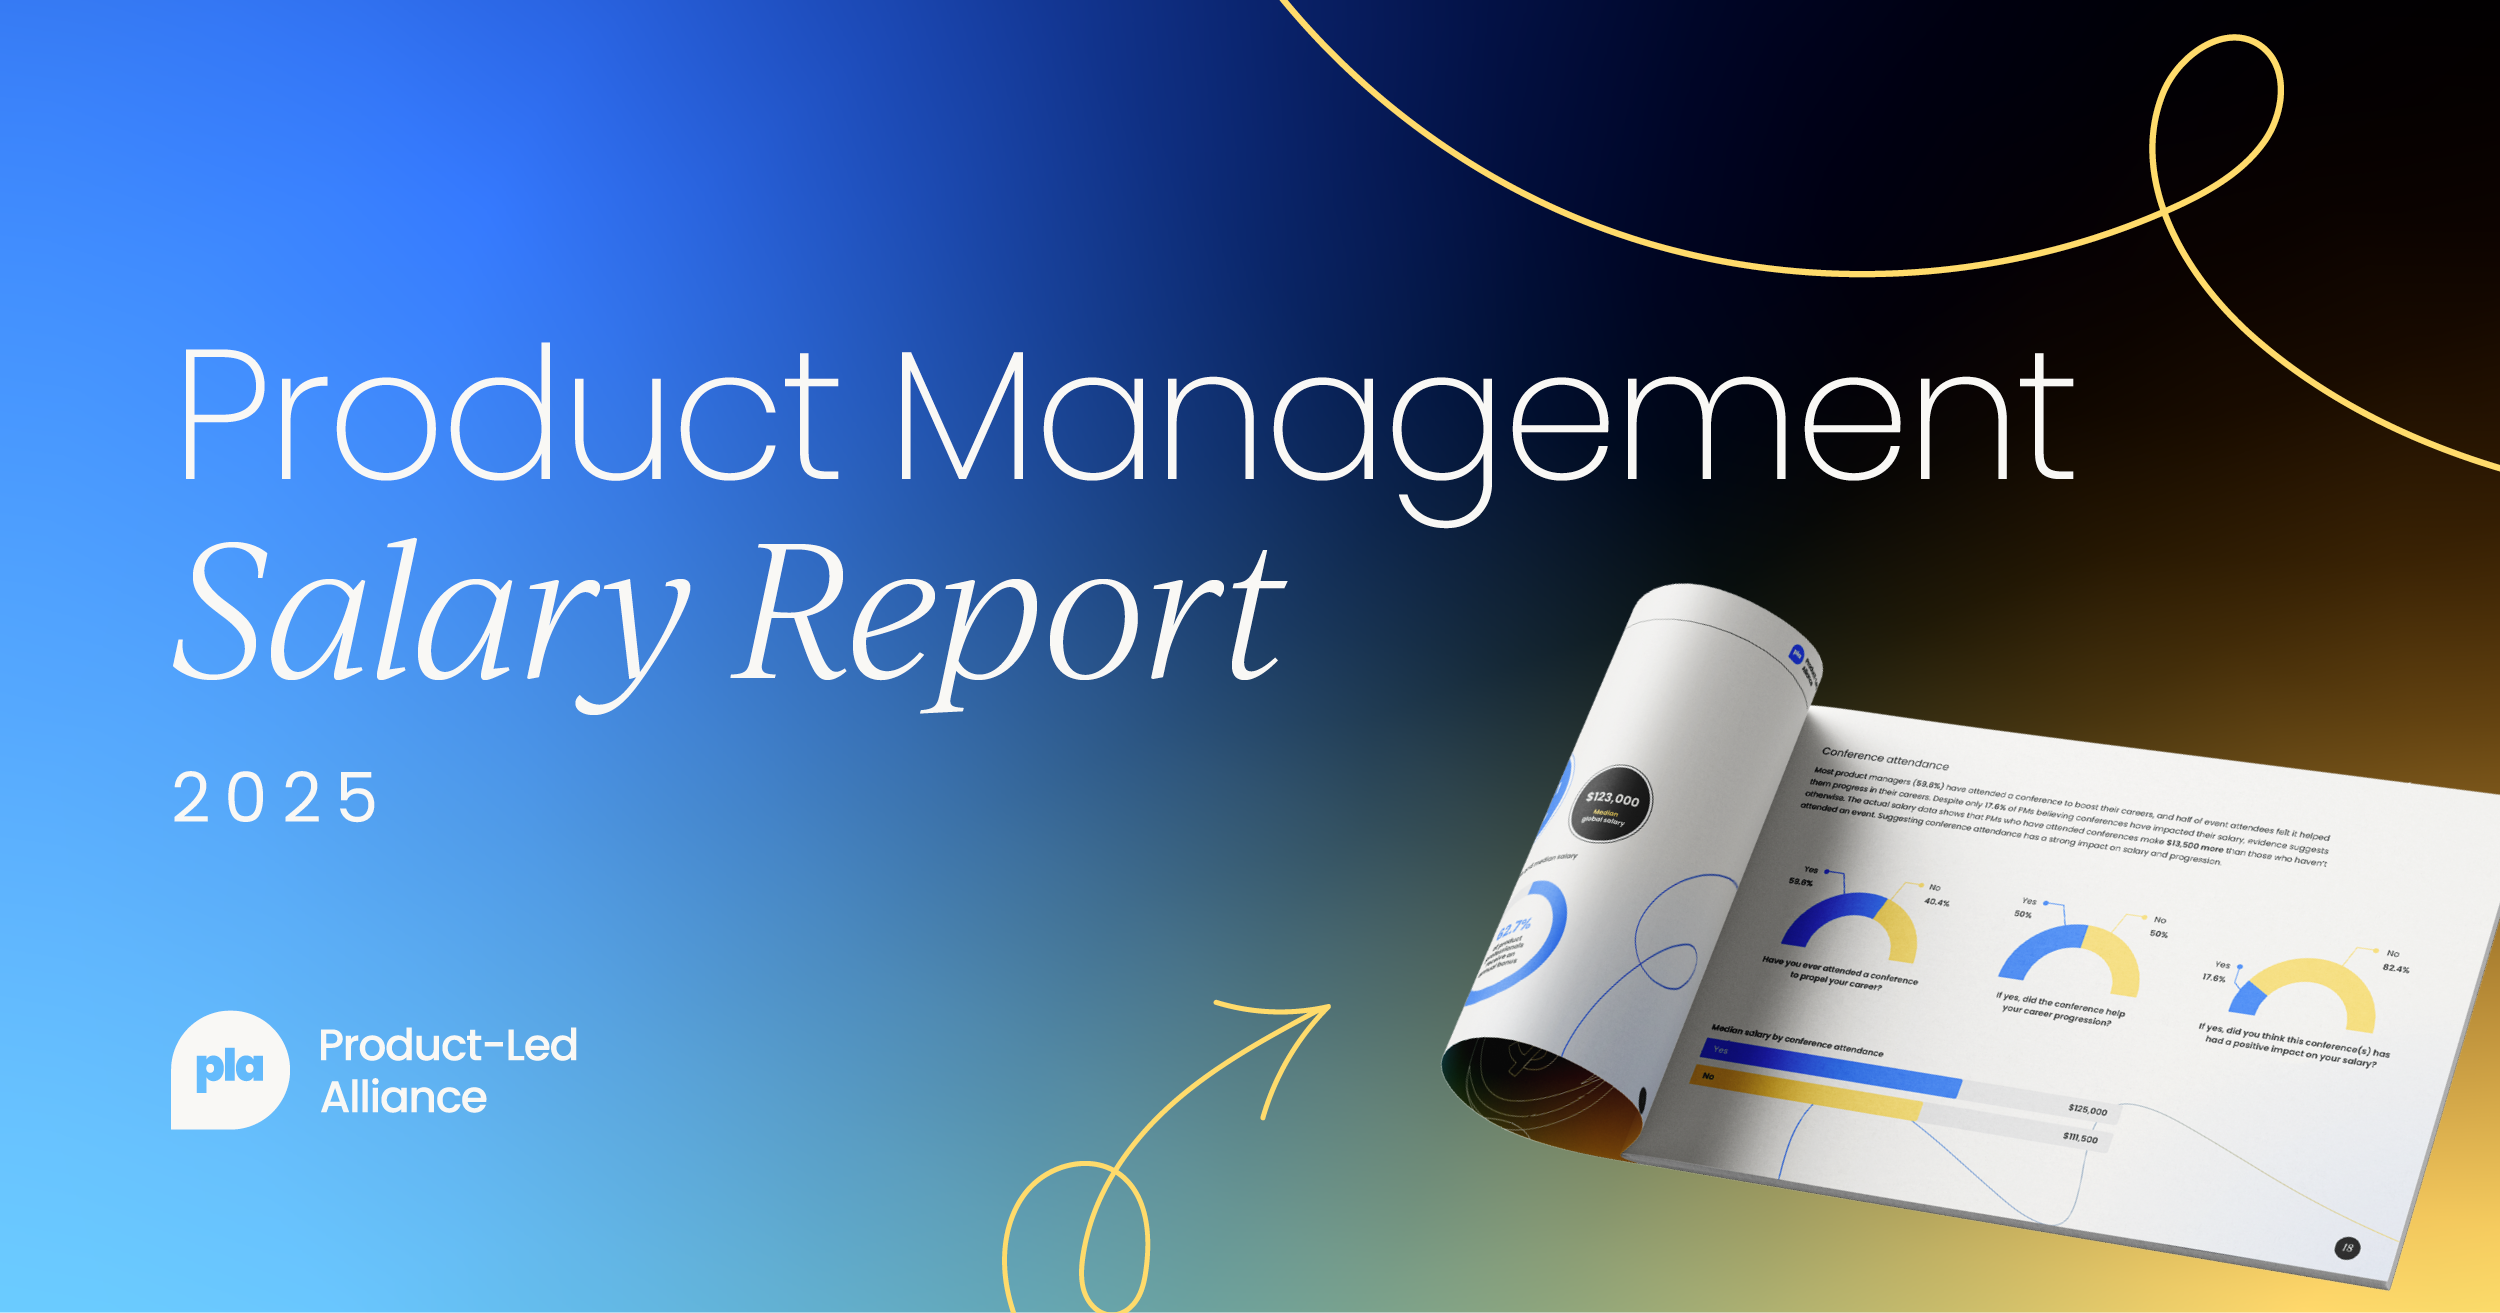
About the data
All statistics on this page are sourced from the State of Product Management Report 2026, produced by Product-Led Alliance in partnership with ProductPlan.
The survey was conducted in Q4 2025 with nearly 250 product professionals across industries, company sizes, and maturity stages — spanning individual contributors (56.7%) and product leaders (43.3%). Where respondents could select multiple answers, totals may exceed 100%.
The report also references: Lenny's Newsletter productivity survey; McKinsey 2025 innovation research; and Bain research on software R&D performance.


Become a PLA Insider
Thank you for subscribing
Get exclusive insights, frameworks, and strategies from product leaders driving real business impact.
An email has been successfully sent to confirm your subscription.
 Follow us on LinkedIn