










I’ve been working on different products that help users discover information relevant to their unique needs. Personalization was the core of those products. If users are interested in something, we show them more of it; if they aren't, we show them less.
The challenge is hidden behind the word "want". How can we tell what a user really wants? Ideally, a personalized product would know whether a user likes or dislikes each item and, when given a list, which items the user prefers more or less. In reality, human preferences are invisible; we cannot read minds and can only guess intentions. The goal of a recommendation engine is to make that guess as accurate as possible.
This brings us to a fundamental product question: How do we know if a new algorithm actually improves the user experience? The standard approach is to run an experiment and monitor engagement metrics like clicks, views, and time spent watching content.
Earlier in my career, I relied heavily on these numbers. I assumed that as long as the metrics were moving in the right direction, the user experience had improved. Different mechanisms might drive the movement, but I didn’t dwell on them. The topline was moving in the right direction, so it was a win.
Over time, as I faced more complex product challenges, I grew uncomfortable with that conclusion. Behavioral metrics indicate activity, but they can mislead us.

Consider a feature I worked on: a carousel of content cards using user swipes to signal engagement. The intuitive interpretation was simple: more swipes meant users loved the carousel. But what if more swipes meant the first items were bad, forcing users to keep exploring for something relevant? The same metric movement could support two opposite narratives.
That realization changed how I evaluate product results. A positive metric is useful evidence but not proof of a better user experience. Today, before celebrating a launch, I ask myself three questions…
1. What else could explain the movement?
The swipe example illustrates a broader principle: every important metric movement can have multiple plausible hypotheses. The question isn’t “Which story favors us?” but “What evidence supports or rules out each explanation?”
A metric captures an isolated action, but the sequence around that action often tells us more. For example, what did users do before swiping? Did they spend enough time on front items or swipe immediately? Another example is clicks. After a click, users who spend meaningful time on the result page count as good clicks, while immediate bounces are bad clicks.
The goal isn’t to find a perfect metric. It’s to develop plausible hypotheses and seek evidence that supports or challenges our claim. When the user journey matches the topline result, the claim is stronger. When they disagree, that disagreement is often the most useful finding.
2. Is the system learning user preferences or reinforcing its own decisions?
Recommendation and personalization systems risk creating a feedback loop. They decide what users see and what users can respond to. Those responses then become data for the model’s next decision.
Let’s reuse the carousel example. In a carousel, only the first few cards appear in the user’s viewport, and users must swipe to see the rest. When testing a new card, it must be placed somewhere before the ranking system has enough data to decide its position.
One option is near the front. This lets all users see it and lets the system collect interactions quickly. However, giving prime space to something of unknown value could harm the existing experience. Its position may also boost early interactions. If the model interprets these as user interest, it may continue to rank the card highly, reinforcing the original placement effect.
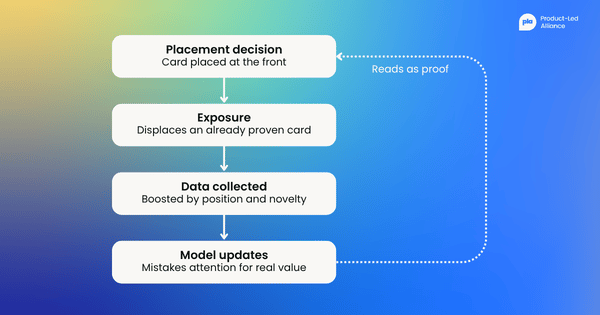
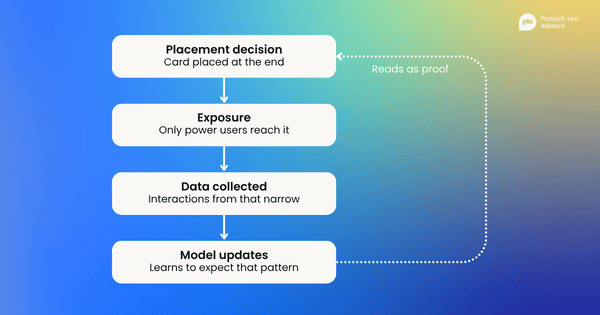
Another option is placing the new card at the end. This protects the experience but creates a different feedback loop. The card gets low visibility, so the system learns more slowly. Also, users who reach the end are likely the most engaged, so interactions are highly biased toward them. The model may then learn the card is not valuable, even though most users never had a fair chance to see it.
There is no universal answer. Different products may use different approaches, but the general principle is the same. We should not interpret behavioral metrics without considering how the system produced the exposure behind them.
The question is not only “Did users engage?” but also “Who had the opportunity to see it, where did they see it, and how did that exposure shape what the system learned next?”
3. Who is better off and who is not?
As product practitioners, we usually report the aggregate metric movement observed in an experiment as the overall impact of a product change. But we all know that users are different. The same change can help one group while making the experience worse for another.
When an experiment produces a negative result, we naturally start slicing the data. We look for the segment driving the metric loss, which may reveal a bug or a design problem that can be addressed in the next iteration. But when the aggregate metric is positive, we’re often less curious. We conclude it’s a win, celebrate, and move on to the next project. However, an aggregate win could be driven by one group benefiting enough to mask a worse experience for another.

I saw this while working on a feature that changed how content looked by default with a filter applied by default. The overall metrics looked positive, so we were ready to launch the feature. But a teammate raised a simple question: he personally did not like having that filter applied by default. That comment prompted us to slice the results by user demographics, and we later found that women responded more positively than men. The average result was accurate but incomplete. The feature was not creating the same experience for everyone.
Heterogeneous effect analysis shouldn’t be used only to debug metric losses; it should also validate metric wins. An aggregate metric shows overall gain but not whether one group pays the price for another’s better experience.
This does not mean examining every slice to find negatives. Instead, use product intuition to develop reasonable hypotheses about which user groups might respond differently and why. Depending on the product, these groups might include demographics, user tenure, or usage patterns. The goal is not to disqualify a positive result but to understand how broadly the benefit is shared.
A three-step checklist
Before announcing that a change improved the user experience, review the experiment results using this short checklist. You do not need an in-depth analysis for every launch. The analysis level should match the potential impact on your users.
- Corroboration: The reason the metric changed is that [Hypothesis A], which is supported by [Evidence B]. [Alternative Hypothesis C] was rejected due to [Evidence D].
- Feedback loop: The feature was visible at [Position/Context] and mainly seen by [Cohort]. Once exposure bias had been accounted for and the monitoring system's learning over time had been considered, the change in the metric [Remained consistent / Shifted], confirming [Conclusion].
- Heterogeneity: When divided into segments, the data reveal that the benefit is [distributed evenly / concentrated in Cohort X] because of [Reason Y].
Since personalization involves making inferences, we can never be certain about each user. A product win is not simply an increase in the topline user engagement metrics. It’s an explanation that outlasts alternative hypotheses, accounts for system bias, and remains valid for all users.


Become a PLA Insider
Thank you for subscribing
Get exclusive insights, frameworks, and strategies from product leaders driving real business impact.
An email has been successfully sent to confirm your subscription.
 Follow us on LinkedIn