










Try to price a fractional CPO the way you would price any other significant purchase, and you hit a wall almost immediately. The providers are easy to find. The prices aren’t.
Across the market, the overwhelming majority of fractional executive providers publish no rate, no retainer, no fee structure of any kind. You’re expected to book a call to learn what a month costs.
I run a fractional product practice, so I live inside this market, and the opacity bothered me enough to do something about it: I collected the published prices myself, all of them I could find.
The result is the Fractional Rates Index, an open dataset of 736 fractional executive providers and 938 of their offerings, compiled in 2026 from each provider's own published pages. My own rate’s one of the published rows, which I figured was the only honest way to run a pricing survey.
This piece is what the dataset shows. The methodology and the raw table are linked at the end so you can check every figure yourself.
Most of the market will not give you a number
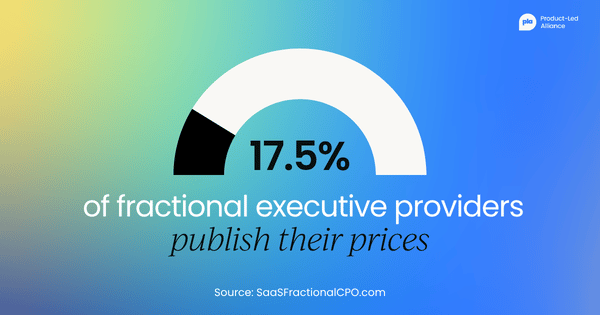
Of 736 providers surveyed, only 129 publish any price at all. That’s a floor of 17.5%: 36 providers could not be read, so the true rate sits somewhere between 17.5% and 22.4%. Either way, more than three-quarters of the market keeps pricing off-page.
Narrow it to providers who specifically offer a Chief Product Officer, and it gets thinner: 14 of 104 CPO-specific providers publish a price. If you have ever felt that pricing a fractional product leader means walking into every sales call blind, this is why. The information asymmetry is structural, and it favors the seller.
Unpublished pricing has a practical consequence beyond inconvenience. A provider with no published rate can calibrate the quote to the buyer: your funding announcement, your title, your urgency.
A published price is a commitment device that makes the quote the same for everyone. When you evaluate providers, the presence or absence of a public number tells you something before you ever speak to them.
What the published market actually charges
The published prices that do exist cluster into a legible market. The dominant structure is the monthly retainer: 747 of the 938 offerings in the dataset are retainer-shaped, against 73 project-priced offerings and roughly two dozen hourly rows.
For USD monthly retainers, the dataset holds 122 priced offerings from 61 providers:
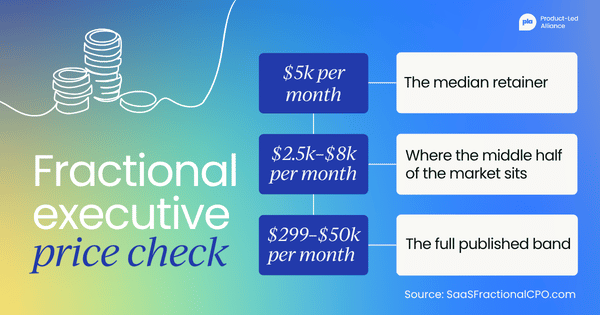
- Median: $5,000 a month
- Middle half of the market: $2,500 to $8,000 a month
- Full published band: $299 to $50,000 a month
The extremes are informative rather than noise. The bottom of the band is productized advice: subscriptions, office hours, templated audits. The top is near-full-time embedded work. The middle half, $2,500 to $8,000, is where engagements that look like an actual fractional executive live.
The pattern holds across currencies. GBP monthly retainers (23 offerings, 12 providers) show a median of £4,000, with a middle half of £1,500 to £7,000. EUR retainers are a thinner sample (12 offerings, 7 providers) with a median of €5,450. Three markets, surveyed the same way, publish to similar centers. Seniority converges; entry points differ.
The billing unit is a cultural artifact
One of the stranger findings: how you are billed depends less on the work than on where the provider learned to invoice.
Hourly pricing barely exists at this level. Twenty USD hourly rates appear in the entire dataset, with a median of $157.50 and a middle half of $98.75 to $256.25.
The scarcity is not an accident. Hourly billing prices tasks; a product leader owns decisions that don’t stop when the clock does, so most senior operators refuse the meter entirely.
Day rates, meanwhile, are a UK convention. The dataset contains eight published GBP day rates (median £1,125, range £600 to £2,500) and not a single USD day rate. Same job, different billing grammar, inherited from the UK contractor culture.
For a buyer, the practical move is to convert everything to a monthly number before comparing.
£1,125 a day at four days a month is £4,500, close to the GBP retainer median. $157.50 an hour at twenty hours a month is $3,150, noticeably below the $5,000 retainer median, which usually signals advisory scope rather than embedded ownership.
The conversion takes 30 seconds and collapses most of the apparent variety in the market into one comparable figure.
The number is only half the price
The retainer tells you less than it appears to, because the hours behind it are even less published than the prices. Hours-included appears on roughly a tenth of the offerings in the dataset, and where it does appear, it’s free text running from "1-12 hrs/month" to "full-time".
Two $5,000 retainers can describe very different amounts of senior attention, and nothing on either page will tell you that.
So, the questions that actually price an engagement are the ones the published number does not answer: how many hours a month, what happens to unused hours, what the response-time expectation is, and who owns outcomes rather than deliverables.
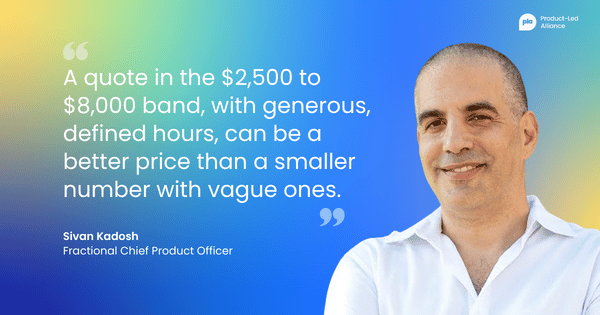
A quote in the $2,500 to $8,000 band, with generous, defined hours, can be a better price than a smaller number with vague ones.
How to read an offer, in practice
Pulling the dataset's findings into a usable sequence:
- Convert the quote to monthly, whatever unit it arrives in.
- Place it against the published middle band, $2,500 to $8,000 for USD. Below the band usually means advisory or productized scope. Above it isn’t wrong, but the burden of proof sits on the provider, and "what does the premium buy?" is a fair question with a benchmark behind it.
- Ask for the hours band in writing, because the market mostly does not publish it.
- Treat an unpublished price as a negotiating fact. You now know the market's center; the provider is hoping you don’t.
- Weight published pricing as a signal. The 129 providers who publish have committed to quoting everyone the same number. That’s not proof of quality, but it is evidence of how they intend to deal with you.
The limits of the data
A dataset like this earns trust by stating what it cannot say. 17.5% is a floor, not a point estimate. Currency is a proxy, not a geography: a EUR row could be anywhere in the eurozone.
The small samples are small: eight day rates and 12 EUR retainers frame a market; they don’t settle it. And published floors are floors; what providers actually close at is a different, unpublishable dataset.
None of that changes the headline. This market asks buyers to negotiate blind against sellers who can see. The prices that are public are enough to fix that if someone collects them, and now they are collected.
The full dataset, sample sizes, and methodology are open at saasfractionalcpo.com/data. Check the numbers; that’s what they’re for.


Become a PLA Insider
Thank you for subscribing
Get exclusive insights, frameworks, and strategies from product leaders driving real business impact.
An email has been successfully sent to confirm your subscription.
 Follow us on LinkedIn