











A product manager I respect once told me they couldn’t understand their retention numbers. Activation was healthy, onboarding completion was high, and the "magic moment" event fired for most new users in the first session. But three months later, more than half of those users were gone, with no single dramatic moment of churn, just a slow fade where each week they used the product a little less than the week before.
The dashboards said the funnel was working, but the behavior said otherwise.
I’ve come to think this is one of the most common product situations there is, and one of the least well-named. Most retention writing treats activation as a milestone: the user reached the moment, the box got ticked, the funnel converted, the rest is a retention problem. But activation isn’t a milestone; it’s a balance, and like any balance, it accumulates debt when you don’t service it.
The PMs who win in product-led growth aren’t the ones who optimize the activation event harder; they’re the ones who recognize that activation is something the product owes the user, in instalments, over the entire first month of use, and that what looks like a retention problem is almost always an activation debt problem in disguise.
This article is about that debt: what it is, how to measure it, why it’s invisible to most product analytics, and what to do about it once you see it.
What is activation debt?
The most useful way I’ve found to think about activation is by borrowing a concept that PMs already understand from engineering: technical debt. In engineering, technical debt is the cost a system accrues when shortcuts are taken now in exchange for future complications.
The shortcut is not always wrong – sometimes it’s the right trade-off. But the debt is real, it compounds, and if you do not actively pay it down, it eventually costs you more than the original shortcut saved.
Activation debt is the same idea applied to product activation. Every time a user finishes onboarding without completing the setup that would actually let them get sustained value, a debt is created.

Every shortcut, every skipped step, every "we will come back to this later" that never happens, every minimum viable setup that satisfies the activation event but doesn’t actually equip the user for the product they will need in three weeks, becomes a small unpaid balance.
These balances do not look like anything at the time. The user activated, the metric fired, the funnel converted. But the debt sits there, quietly making every subsequent interaction with the product slightly worse than it could have been, until one day the user stops opening the product and no one can tell you exactly when or why.
The reason this matters so much is that activation debt doesn’t behave the way most PMs think activation behaves. Activation, in most analytics, is binary: the user did the thing, or they didn’t. Activation debt is continuous, accumulating quietly across the first thirty, sixty, ninety days of use, almost never visible in any single event, almost always visible in the aggregate behavior of users who are slowly disengaging from a product they never quite finished setting up.
Why standard activation metrics miss it
Most product teams think about activation as a milestone event. You define an activation moment, you measure who reaches it, and you optimize the funnel that leads to it.
This works, in the sense that it gives you a number you can move. It doesn’t work, in the sense that the number it gives you is increasingly disconnected from the long-term value users get from your product.
The problem is that any activation event you can define is a snapshot, and snapshots cannot capture balances. If your activation event is "user invites a team member," you can absolutely measure how many users invite a team member.
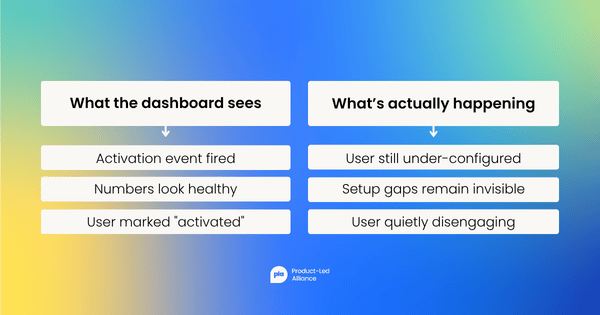
What you can’t measure with that single event is whether the user invited the right team members, whether they configured the workspace in a way that would let those team members actually collaborate, whether they set up the integrations the team will need, whether they understood enough of the product to know what to set up next. The event fires, and the debt accumulates regardless.
And because the debt does not fire any event in your analytics, it doesn’t show up anywhere in the funnel. By the logic of your dashboards, the user is fine. However, in reality, they’re not. They’re quietly accumulating gaps in their setup that will, over the next thirty to sixty days, make the product less useful to them, less central to their workflow, and eventually easier to abandon.
The analytics will say they churned. The reality is that they were never fully activated in the first place.
How to actually measure activation debt
Defining activation debt is one thing; measuring it is another. This is where most teams give up, because standard analytics tools are not built to capture balances, and any custom measurement requires you to think about your product in a way that you may not have thought about it before.
The measurement approach that works, in my experience, has three layers, and they have to work together because no single layer captures the full picture.
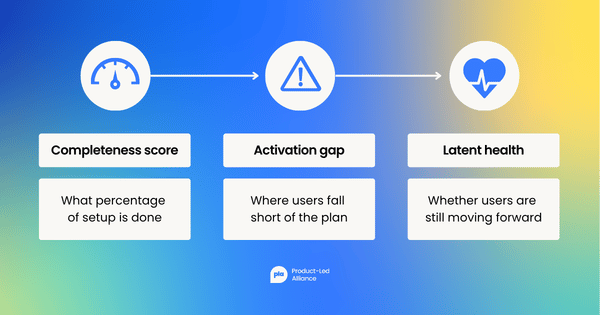
Layer 1: The activation completeness score
For your product, define the set of actions that constitute a fully activated user, not the minimum activation moment but the full set. For a project management tool, this might be workspace created, team invited, first project set up, first task assigned with a deadline, integrations connected, and notifications configured.
Now, for each user, calculate what percentage of that full set they have actually completed at any given time. This is your activation completeness score. A user at 100% has no activation debt. A user at 30% has 70% activation debt, even if the binary activation event fired weeks ago.
Layer 2: The activation gap
This is the difference between the activation behavior your product was designed to produce and the activation behavior your users are actually producing. If your designed onboarding flow assumes users will reach completeness within seven days, and the median user reaches 60% completeness in seven days, your activation gap is 40%.
This number, tracked over time, tells you whether your activation is improving or whether your debt is silently growing despite all your onboarding optimization work.
Layer 3: Latent activation health
This layer is the most predictive of long-term retention. Latent activation health is the probability that a user, at their current activation completeness score, will return to deepening behavior over the next thirty days.
You calculate this by looking at historical cohorts: at each level of activation completeness, what percentage of users move forward in the next month, and what percentage stay flat or move backward?
Users with low latent activation health aren’t yet churning, but they’re no longer activating either. They’re sitting on debt that they are unlikely to pay down without intervention.
These three measurements, taken together, let you see activation as the balance it actually is, rather than as the moment it is conventionally measured to be.
They won’t show up in your default analytics tools – you’ll have to build them. They’re worth building because once you can see them, the rest of the product becomes a different conversation.
The compounding effect
Activation debt is dangerous in the same way technical debt is dangerous, which is that it does not compound linearly. Each unaddressed gap makes the next gap harder to address, not just because the user is now navigating an under-configured product, but because their relationship to the product itself shifts when the product stops feeling like it is working for them.
Take a concrete example. A user signs up for a team collaboration product, sets up their own profile, completes onboarding, and then never invites their team. The activation event fires because they reached "first project created."
Their activation completeness score is, let’s say, 40%. Without the team invited, every interaction is solitary, which means the product never demonstrates the value proposition it was built for. Without integrations, every workflow has friction the product was designed to eliminate. Without notifications configured properly, the user doesn’t get pulled back at the right moments, so the natural habit loop never forms.
None of these are dramatic failures; each one is just a small drag on every interaction. But because each drag is invisible to your analytics, and because each drag makes the user slightly less likely to return tomorrow, the debt compounds.
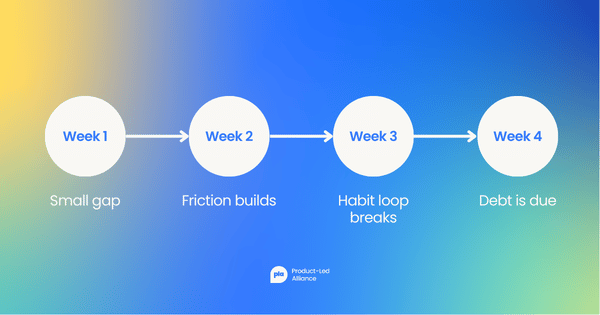
By week four, the user isn’t just less activated than they were at week one; they’re now in a state where the next activation step is harder to take, because it requires more energy to reverse course than it would have taken to set things up correctly in the first place.
Retention, in this framing, isn’t a separate problem from activation. Retention is the downstream behavior of users who either paid down their activation debt or did not.
Architectural responses
Once you accept that activation is a balance and that activation debt compounds, the product response is structural rather than tactical. You’re not going to fix activation debt with a better tooltip or a more polished onboarding tour. You’re going to fix it by designing the product so that activation continues to happen, deliberately, across the first 30 to 90 days of use.
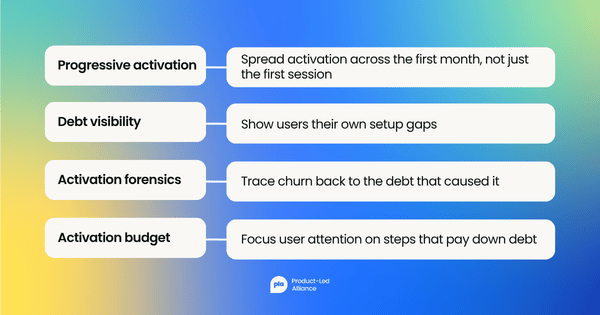
There are four architectural patterns I now reach for when I think about this.
Pattern 1: Progressive activation
The first is what I call progressive activation. This means treating activation not as a single sequence of events at the start of the user's relationship with the product, but as a designed series of activation moments spaced across the first month.
Most products front-load activation into the first session and then trust the product to carry the user forward. Progressive activation inverts this. The first session establishes a minimum, the second session deepens it, the third session adds the layer that requires the first two to be in place.
Each session is designed to pay down a specific piece of activation debt, in a specific order, with a specific reason for that order.
Pattern 2: Activation debt visibility
The second pattern is activation debt visibility, which sounds obvious but is almost never done.
Most product teams measure activation rates but never surface activation completeness to users themselves. The best products I have seen do the opposite: they show users their own activation state, often as a progress indicator or a checklist, and they make the next activation step the easiest thing on the screen. This works because activation debt that the user can see is debt the user can act on, so it's less likely to compound; hidden debt is debt that compounds.
Pattern 3: Activation forensics
The third pattern is what I think of as activation forensics, which is the practice of treating every churn event as a question about what activation debt predicted it. When a user churns, the question you ask is not "what feature should we have built to keep them?" but "what activation steps were they missing at the point they stopped engaging, and at what point did that gap become predictive of churn?"
Over time, this builds a quantitative model of which specific pieces of activation debt are most predictive of long-term loss, and lets you prioritize debt reduction work the same way you would prioritize any other product investment.
Pattern 4: Activation budget
The fourth pattern is the activation budget. Every product has finite attention from a new user. You can spend that attention on showing them features, asking them to set things up, walking them through tours, or moving them toward the activation moments that matter. Most products spend this budget poorly, optimizing for engagement events that don’t pay down activation debt.
The architectural response is to treat the user's attention as a budget you are allocating against specific debt-paying activation steps, and to ruthlessly cut the activities that do not move the activation completeness score.
Two short illustrative vignettes
To make this concrete, consider two products I will keep deliberately anonymous.
Vignette 1: The debt hiding inside a healthy metric
Picture a knowledge management tool aimed at small teams. The team behind it had a healthy activation event firing rate, around 75% of new sign-ups created a workspace and added at least one note. They had average retention curves at thirty and sixty days. They couldn’t understand why their power users seemed to come from a specific subset of new sign-ups that they couldn’t predict from the activation event alone.
When they built the activation completeness measurement, the picture became clear. The 75% activation rate was misleading. Of those activated users, only about 20% had completed the additional setup that distinguished long-term users: workspace permissions configured, at least three notes created with proper tagging, the search function used at least once, integrations connected. The 20% retained at much higher rates. The 80% drifted away over the following sixty days.
Once they could see the debt, the product team’s response was swift. They redesigned the second-session experience to surface the most predictive missing activation steps, sequenced in the order their model said mattered most. They built a simple progress indicator that showed users their activation completeness state.
Within a quarter, their thirty-day retention had improved noticeably, not because they had built new features, but because they had made activation an ongoing balance the team was deliberately managing.
Vignette 2: The signal the dashboard couldn't see
The second example is a B2B analytics product, where the activation event was "first data source connected." Nearly all new accounts cleared that bar quickly, but six-month retention was a different story.
When the team built activation forensics for churned accounts, the divergence traced to one specific dimension of activation debt: accounts that had not configured at least one alert by week three were several times more likely to churn at six months, regardless of how often they logged in during weeks one and two.
Frequent logins without alerts predicted almost nothing. Infrequent logins with alerts predicted retention reliably. The activation debt around alerts was producing all of the predictive signal, and the analytics dashboards, which were measuring login frequency and feature usage, were missing it entirely.
The architectural response was not to push more alerts as a feature, but to redesign the second-week experience so that configuring the first meaningful alert became the most natural next thing for any new account to do. Within two cohorts, the predictive gap had narrowed substantially.
Both examples share a structure. The activation event told the team they had succeeded. The activation completeness measurement told them where the debt actually was. The architectural response paid it down before it compounded.
What this changes for how you think about the work
The shift activation debt represents, more than any single tactic, is a shift in how you frame the activation problem at all.
The default frame treats activation as a marketing funnel: how do we get more users to the moment? The activation debt frame treats activation as an ongoing balance: how do we keep users closing the gaps in their setup over time, deliberately, with measurement and architecture, until the debt is fully paid down or the user has been retained long enough that they will pay it down on their own?
For product managers working in product-led growth environments, almost all the leverage sits in the gap between the activation event you currently measure and the full activation state you currently do not. The teams that are winning at PLG right now are the ones who have closed that gap. The teams that are losing are still optimizing the activation event harder, hoping that better tooltips and clearer copy will somehow surface the debt they have not yet learned to see.
If you do the work of building these measurements and designing the architectural responses against them, the retention curve that has confused you for the last six months will start to make sense. Not because the users changed, but because you started measuring the thing that was actually moving them.


Become a PLA Insider
Thank you for subscribing
Get exclusive insights, frameworks, and strategies from product leaders driving real business impact.
An email has been successfully sent to confirm your subscription.
 Follow us on LinkedIn